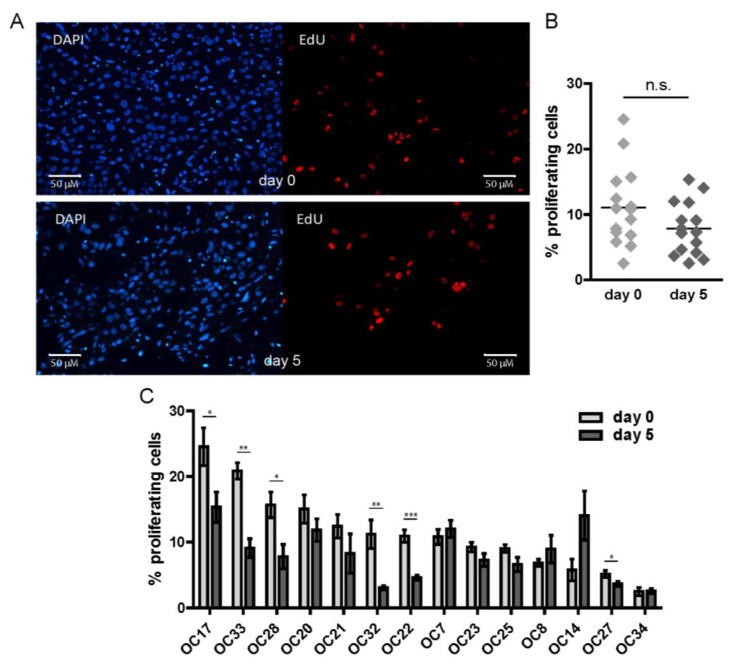
Figure 2.
HNSCC tumor cells maintain proliferation during five days of culture. (A) Representative microscopy images of EdU staining at day 0 and day 5 of the ex vivo culture. (B) Quantification of the EdU-positive cells at day 0 and day 5 of the ex vivo culture. Each point represents the mean of ≥3FoV per sample, and the mean across all day 0 or day 5 samples is indicated with a horizontal line. (C) Change in the % of EdU-positive cells upon five days of culture. Each graph bar represents the mean of ≥3 FoV and error bars represent SEM. A t-test was used to determine significance. n.s. = non-significant; * p < 0.05; ** p < 0.01; *** p < 0.001.

