Figure 5.
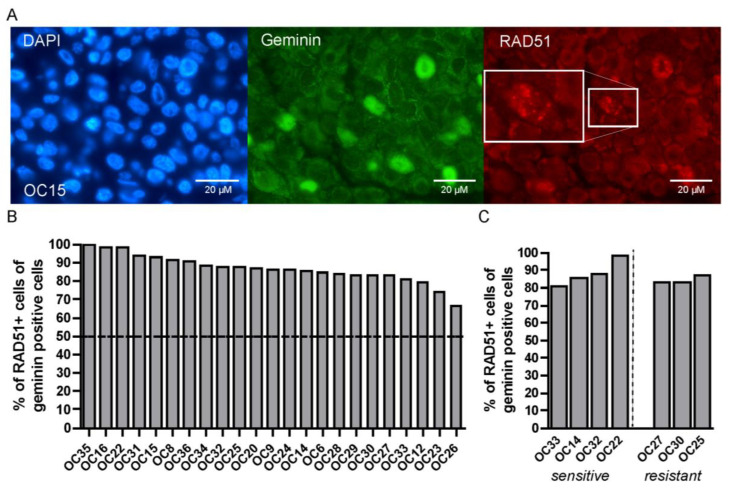
All tested HNSCC tumors form RAD51 foci 2 h after IR. (A) Representative microscopy images of geminin (green) and RAD51 (red) staining; DAPI is shown in blue. (B) Quantification of % of RAD51 positive cells within the geminin positive cells. Each bar is representative of one tumor sample. (C) Comparison of % of RAD51 positive cells within the geminin positive cells in the IR-sensitive and IR-resistant OC samples. Each bar is representative of one tumor sample.

