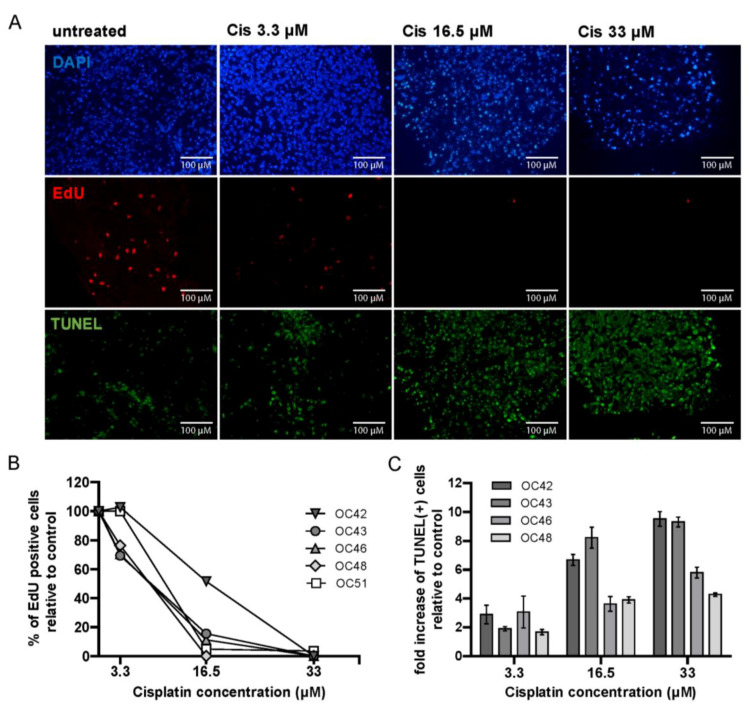
Figure 6.
HNSCC tumor slices show heterogeneous response to cisplatin. (A) Representative microscopy images of a tumor sample treated with increasing concentrations of cisplatin. DAPI is shown in blue, EdU in red and TUNEL in green. (B) Quantification of EdU positive cells upon treatment with increasing concentrations of cisplatin, relative to the untreated control. Each point represents the mean value of ≥3 FoV per sample. For clarity of the graph, SEM is not shown. (C) Quantification of TUNEL positive cells upon treatment with increasing concentrations of cisplatin relative to untreated control. Each bar represents the mean value of ≥4 FoV per sample, and error bars indicate SEM. Cis = cisplatin.

