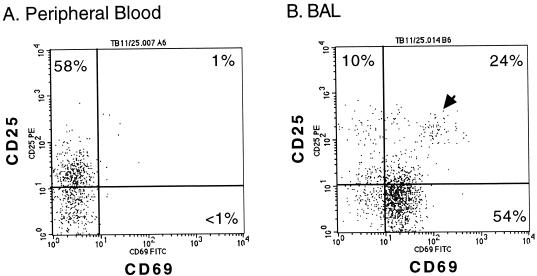
FIG. 4.
Expression of CD25 and CD69 on CD4+ lymphocytes from the PB and BAL fluid of a healthy PPD− subject. Viable cells were labeled and analyzed as described for Fig. 3. The distribution of events in each quadrant is given as percent CD4+ lymphocytes. Quadrants located in the same position are used to analyze both histograms. A cluster of CD25bright CD69bright events in the right histogram is indicated by an arrowhead. This subset constituted 8.4% of the CD4+ lymphocytes in this BAL fluid specimen.

