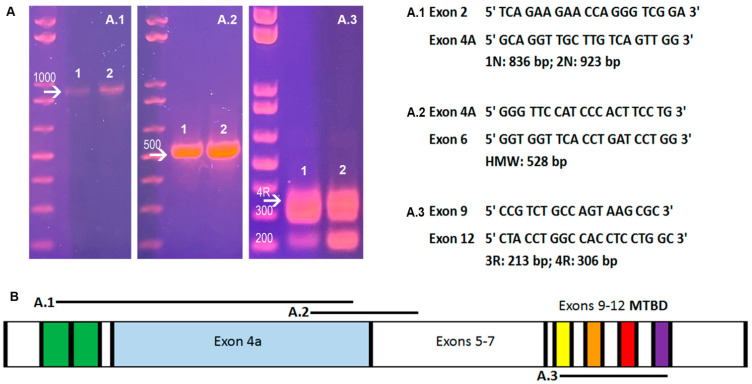
Figure 2.
Exon structure of Big tau in SCG and DRG. (A) shows PCR analysis of DRG (1) and SCG (2) indicating the presence of exons 2 and 3 at the N-terminal (A.1), exons 4A and 6 (A.2); and exon 10 indicating a 4R structure (A.3). The sequence of the primers shown on the right side of the PCR images. (B) shows a graphical representation of Big tau exons and the PCR products.

