Figure 9.
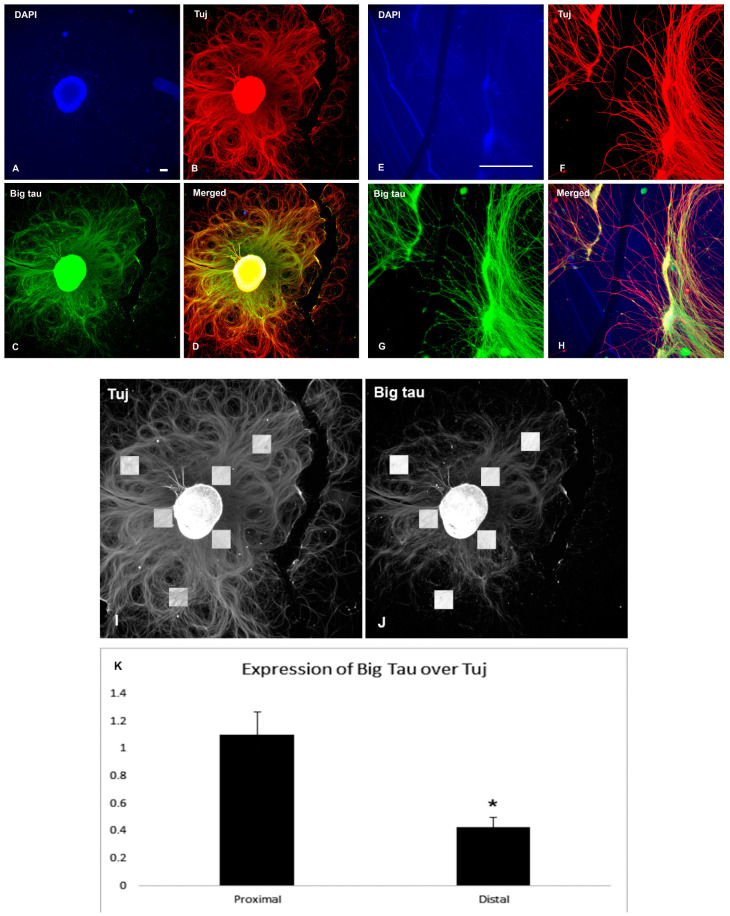
Big tau expression after SCG explant lesion (4 h). The analysis shows 2 sets of P3 SCG explants that were cultured for 8 days, and then grown for 4 h after lesion. Panels (A–D) show SCG explant lesion at low magnification. Panels (E–H) show SCG neurites growing near the lesion area at the high magnification. DAPI staining (A,E), Big tau staining (C,G), Tuj staining (B,F), and double staining (D,H) demonstrates neurite growth and expression of Big tau and Tuj 4 h after the lesion. The analysis of the ratio of Big tau/Tuj 4 h after lesion is based on data presented in (B,C). Panels (I,J) indicate the proximal and distal locations (n = 3) of the areas included in the average density calculation, respectively, expressed as a ratio of Big Tau over Tuj (K). The ratios of Big tau/Tuj densities are significantly lower in the distal explant relative to proximal (* p = 0.02). Scale bar = 100 µm.

