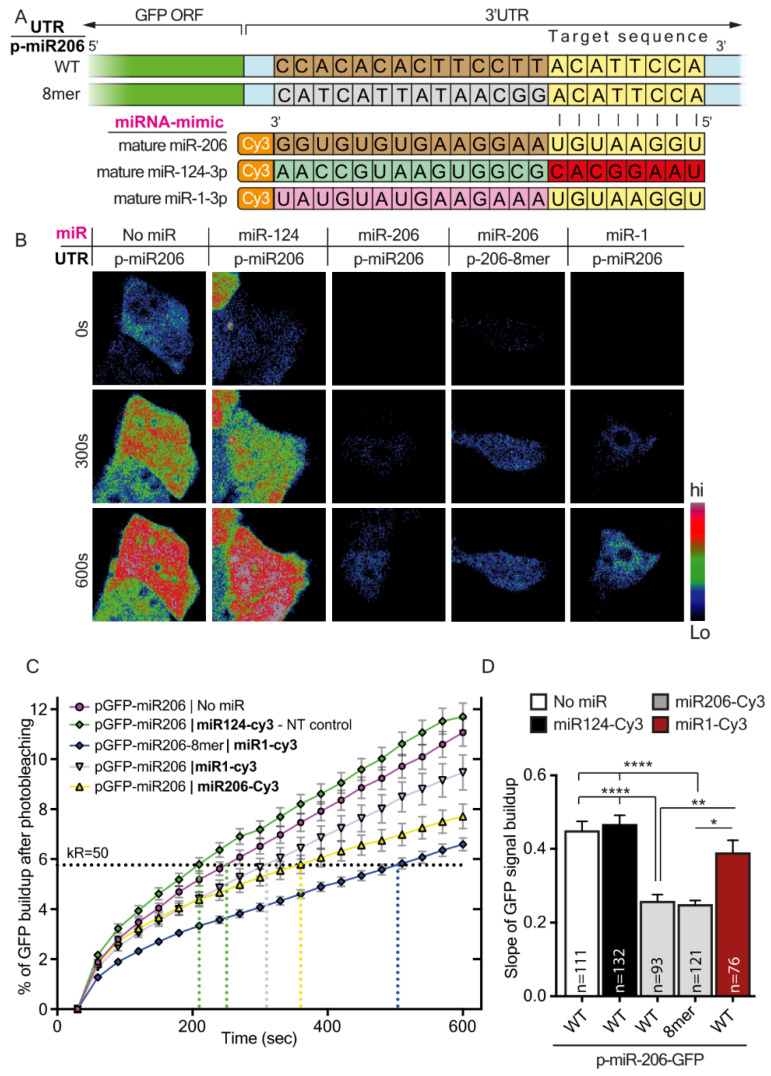
Figure 2.
Target GFP downregulation as a function of canonical site variations applies also for miR-206-3p. (A) Schematic illustration of the experimental setup. Two dGFP expression plasmids containing miR-206-3p canonical sites in the 3′UTR of dGFP were each co-transfected together with mature Cy3-miR-206 or mature Cy3-miR-1, or mature Cy3-miR-124 as a control, into 293T cells. Green indicates the GFP coding sequence (CDS); light blue indicates the 3′UTR of dGFP; nucleotides labeled in brown indicate nucleotides in full complementation to mature miRNA; nucleotides labeled in grey indicate random nucleotides not complementing the full sequence of mature miR-1; nucleotides labeled in yellow and red indicate nucleotides in the miRNA target sequence that are complementary and non-complementary, respectively, to the seed sequence; nucleotides labeled in light-green and pink highlight the sequence differences between mature miR-206, miR-124, and miR-1. (B) Representative images of dGFP in 293T cells carrying miR-206 canonical sites in 3′UTR. The images show three time points for each cell: 0 min, 5 min, and 10 min after photobleaching. (C) The graph shows the cumulative percent of fluorescence of dGFP during the 10 min following photobleaching. The horizontal KR50 line indicates the Y value at which 50% of the maximal recovery is achieved in the non-targeting control. (D) Quantification of the mean slope of dGFP recovery after photobleaching. Ordinary one-way ANOVA **** p < 0.0001. Post-hoc multiple comparisons: * p-value < 0.05, ** p-value < 0.01, **** p-value < 0.0001.

