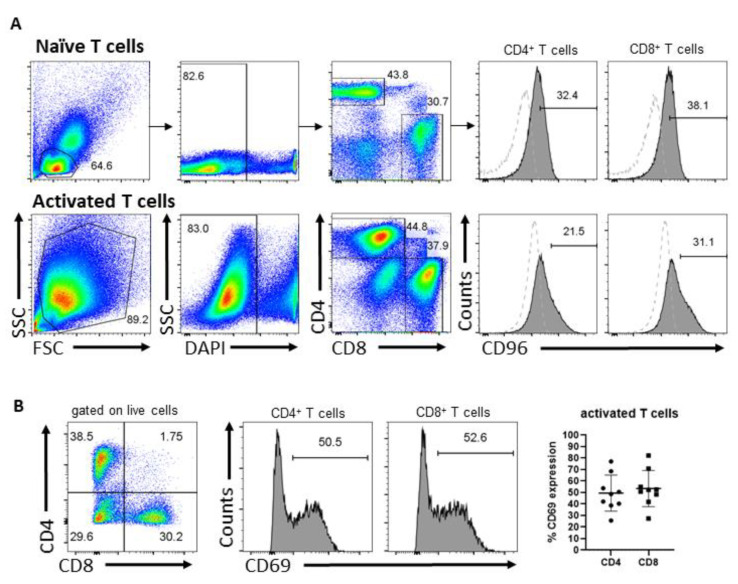
Figure 1.
CD96 and CD69 expression in T cells. (A) Expression of CD96 in naïve CD4+ and CD8+ T cells at day 0 (top) and T cells activated by anti-CD3 and anti-CD28 Abs for 3 days (bottom), including the gating strategy. Dotted histogram represents CD96 fluorescence minus one (FMO) control cells. (B) Expression of CD69 in viable CD4+ and CD8+ T cells activated for 3 days as assessed by flow cytometry. Data in (A) are representative of 2 independent experiments. Data in (B) are representative of T cells from at least 4 independent donors assessed in at least 3 independent experiments.

