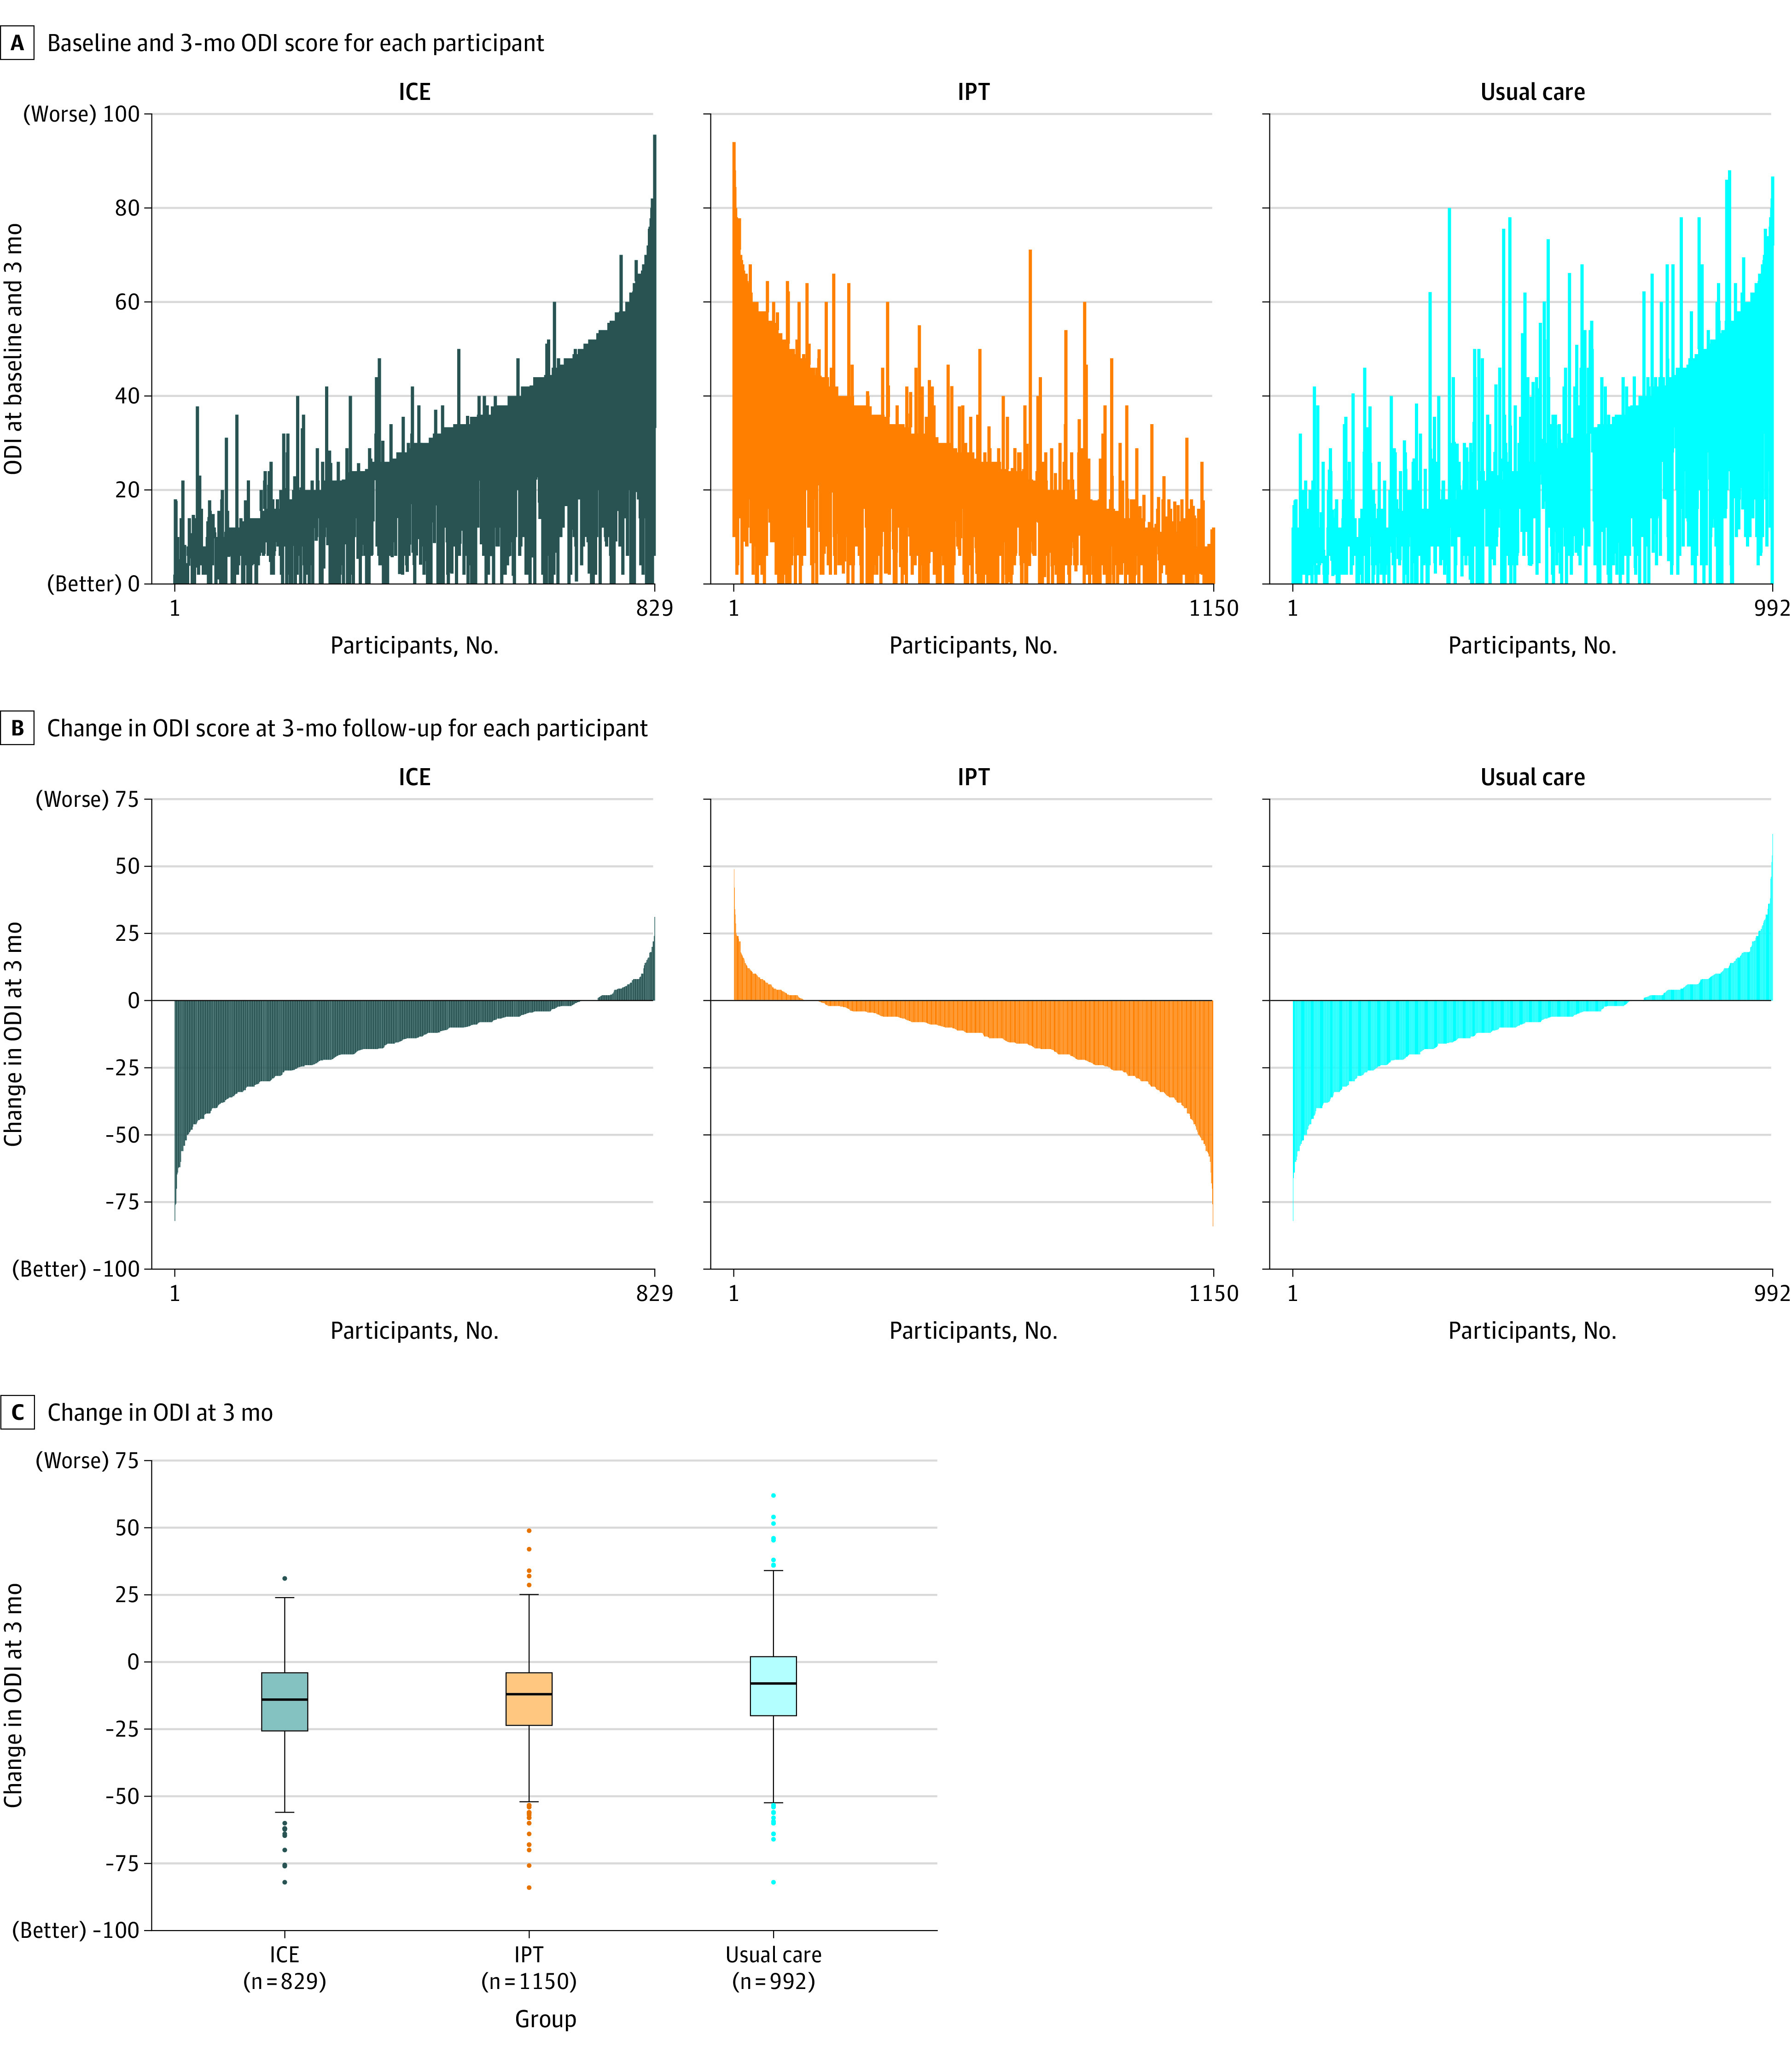
Figure 2. Baseline, 3-Month Follow-up, and Change in Oswestry Disability Index Score at 3 Months Among Participants With Acute and Subacute Back and Neck Pain.

ICE indicates identify, coordinate, and enhance; IPT, individualized postural therapy; and ODI, Oswestry Disability Index.
A, Each vertical line represents an individual participant, with participants ordered by baseline value and the vertical line extending up (deterioration) or down (improvement) to the 3-month value.
B, Vertical lines extending down denote the degree of improvement in ODI score at 3-month follow-up. Vertical lines extending up denote the degree of decline in ODI score.
C, Each box ranges from the 25th (top) to 75th (bottom) percentile of the distribution with the black horizontal line signifying the median. The whiskers extend to the furthest points that are within the 1.5 × IQR of the box (the upper and lower adjacent values). The solid circles beyond the whiskers represent more extreme values.
