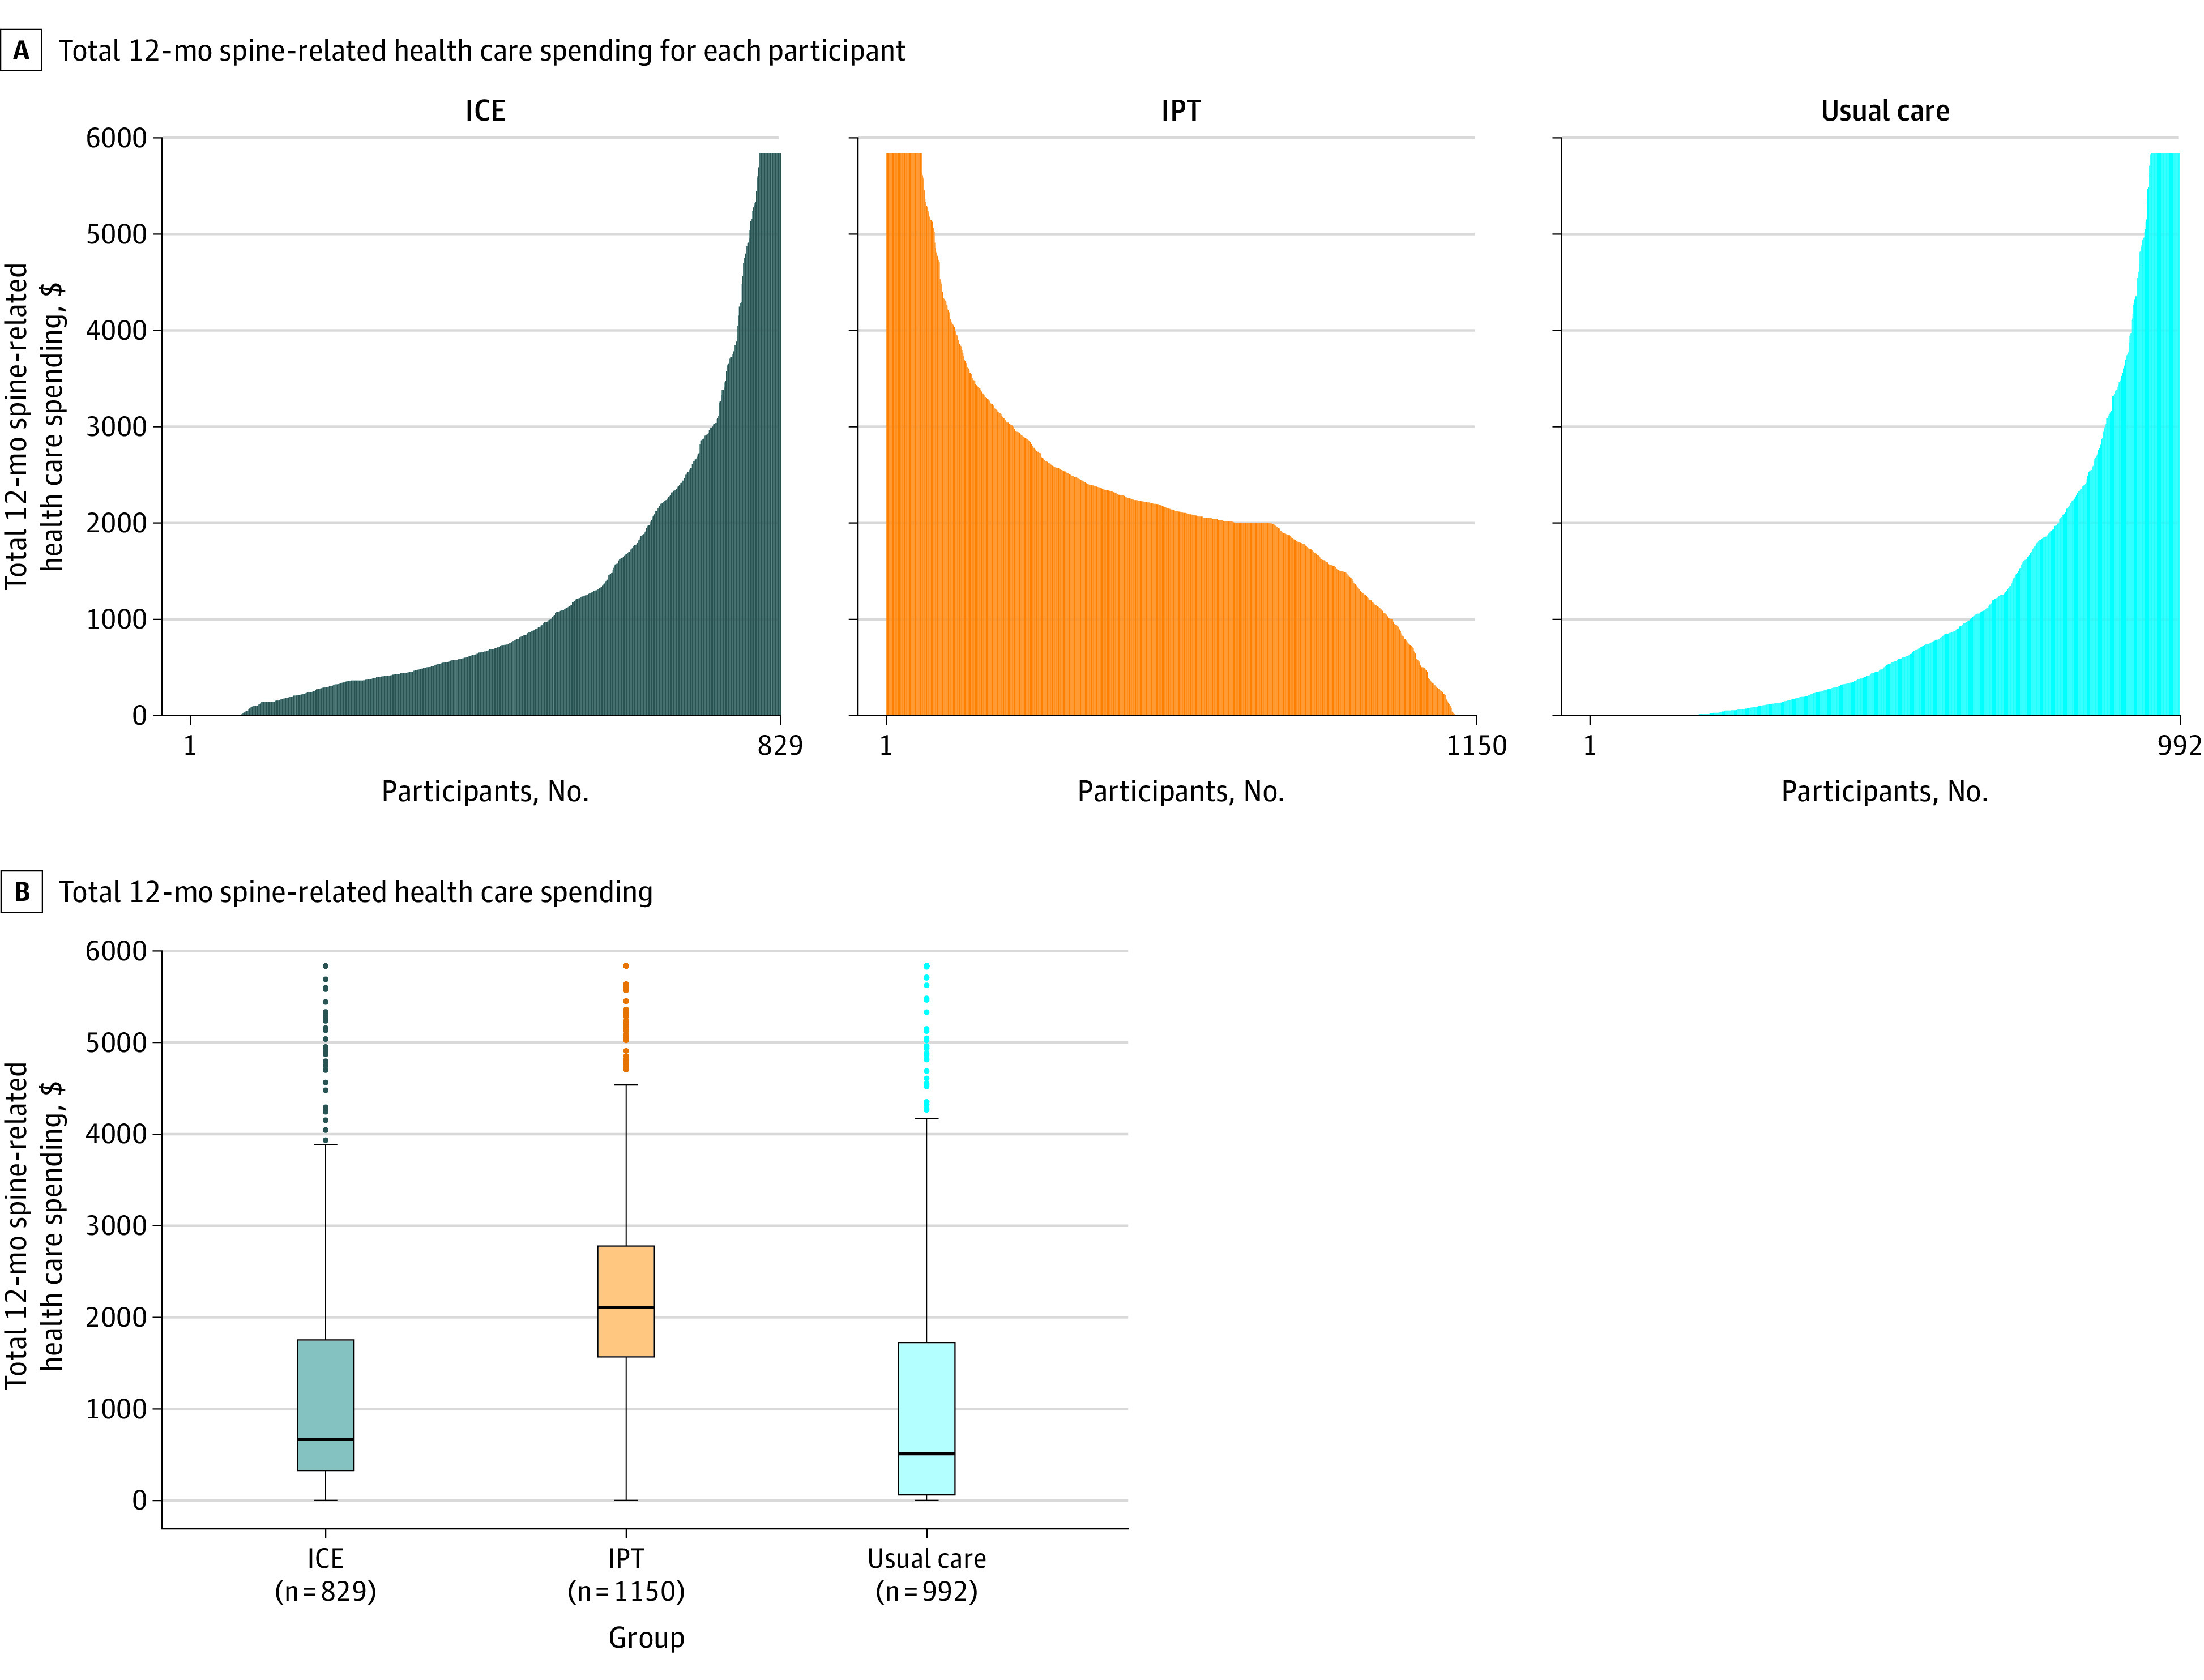
Figure 3. Total Spine-Related Health Care Spending at 12 Months Among Participants With Acute and Subacute Back and Neck Pain.

ICE indicates identify, coordinate, and enhance; and IPT, individualized postural therapy.
A, Each vertical line represents the cumulative spine-related over 12 months of follow-up for each participant. Values are winsorized at the 95th percentile for the graphical representation. This 95th percentile threshold was $5837 and winsorization was done for 31 patients in the ICE group, 68 patients in the IPT group, and 49 patients in the usual care group.
B, Each box ranges from the 25th (top) to 75th (bottom) percentile of the distribution with the black horizontal line signifying the median. The whiskers extend to the furthest points that are within the 1.5 × IQR of the box (the upper and lower adjacent values). The solid circles beyond the whiskers are outliers. Values are winsorized at the 95 percentile for the graphical representation.
