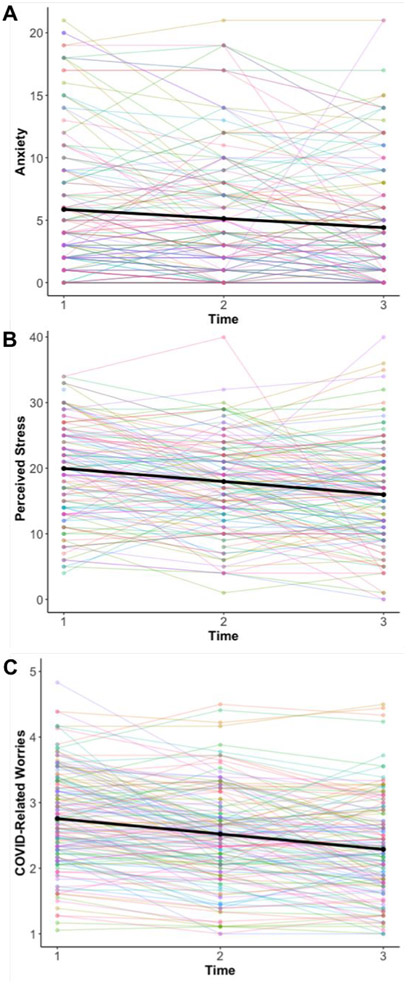
Figure 1.
Average trajectories of anxiety, perceived stress, and COVID-related worries from T1 (April-May) to T3 (June-July). Black lines represent predicted trajectory based on growth curve parameters. Color lines represent each individual’s trajectory based on their raw data. COVID represents the coronavirus disease of 2019. All unconditional models had acceptable fit: Anxiety model (χ2(1) = 0.01, p = .94, RMSEA = .00, SRMR = .00, CFI = 1.00), Perceived Stress model (χ2(1) = 0.79, p = .373, RMSEA = .00, SRMR = .02, CFI = 1.00), and COVID-related worries model (χ2(1) = 1.94, p = .16, RMSEA = .07, SRMR = .02, CFI = 1.00).

