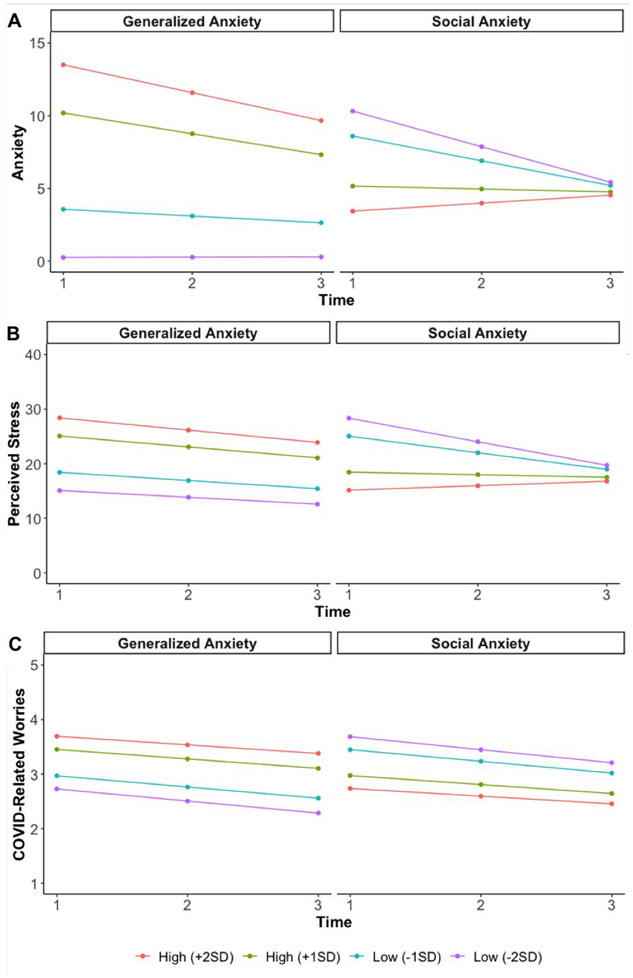
Figure 2.
Trajectories of anxiety, perceived stress, and COVID-related worries from T1 (April-May) to T3 (June-July) for different levels of generalized and social anxiety. For reference, when extracting factor scores from the generalized and social anxiety factors measurement model (see supplement), individuals diagnosed with generalized anxiety are 2.1 SDs above from the mean and individuals diagnosed with social anxiety are 1.4 SDs above the from the mean. COVID is the coronavirus disease of 2019. SD represents standard deviation.

