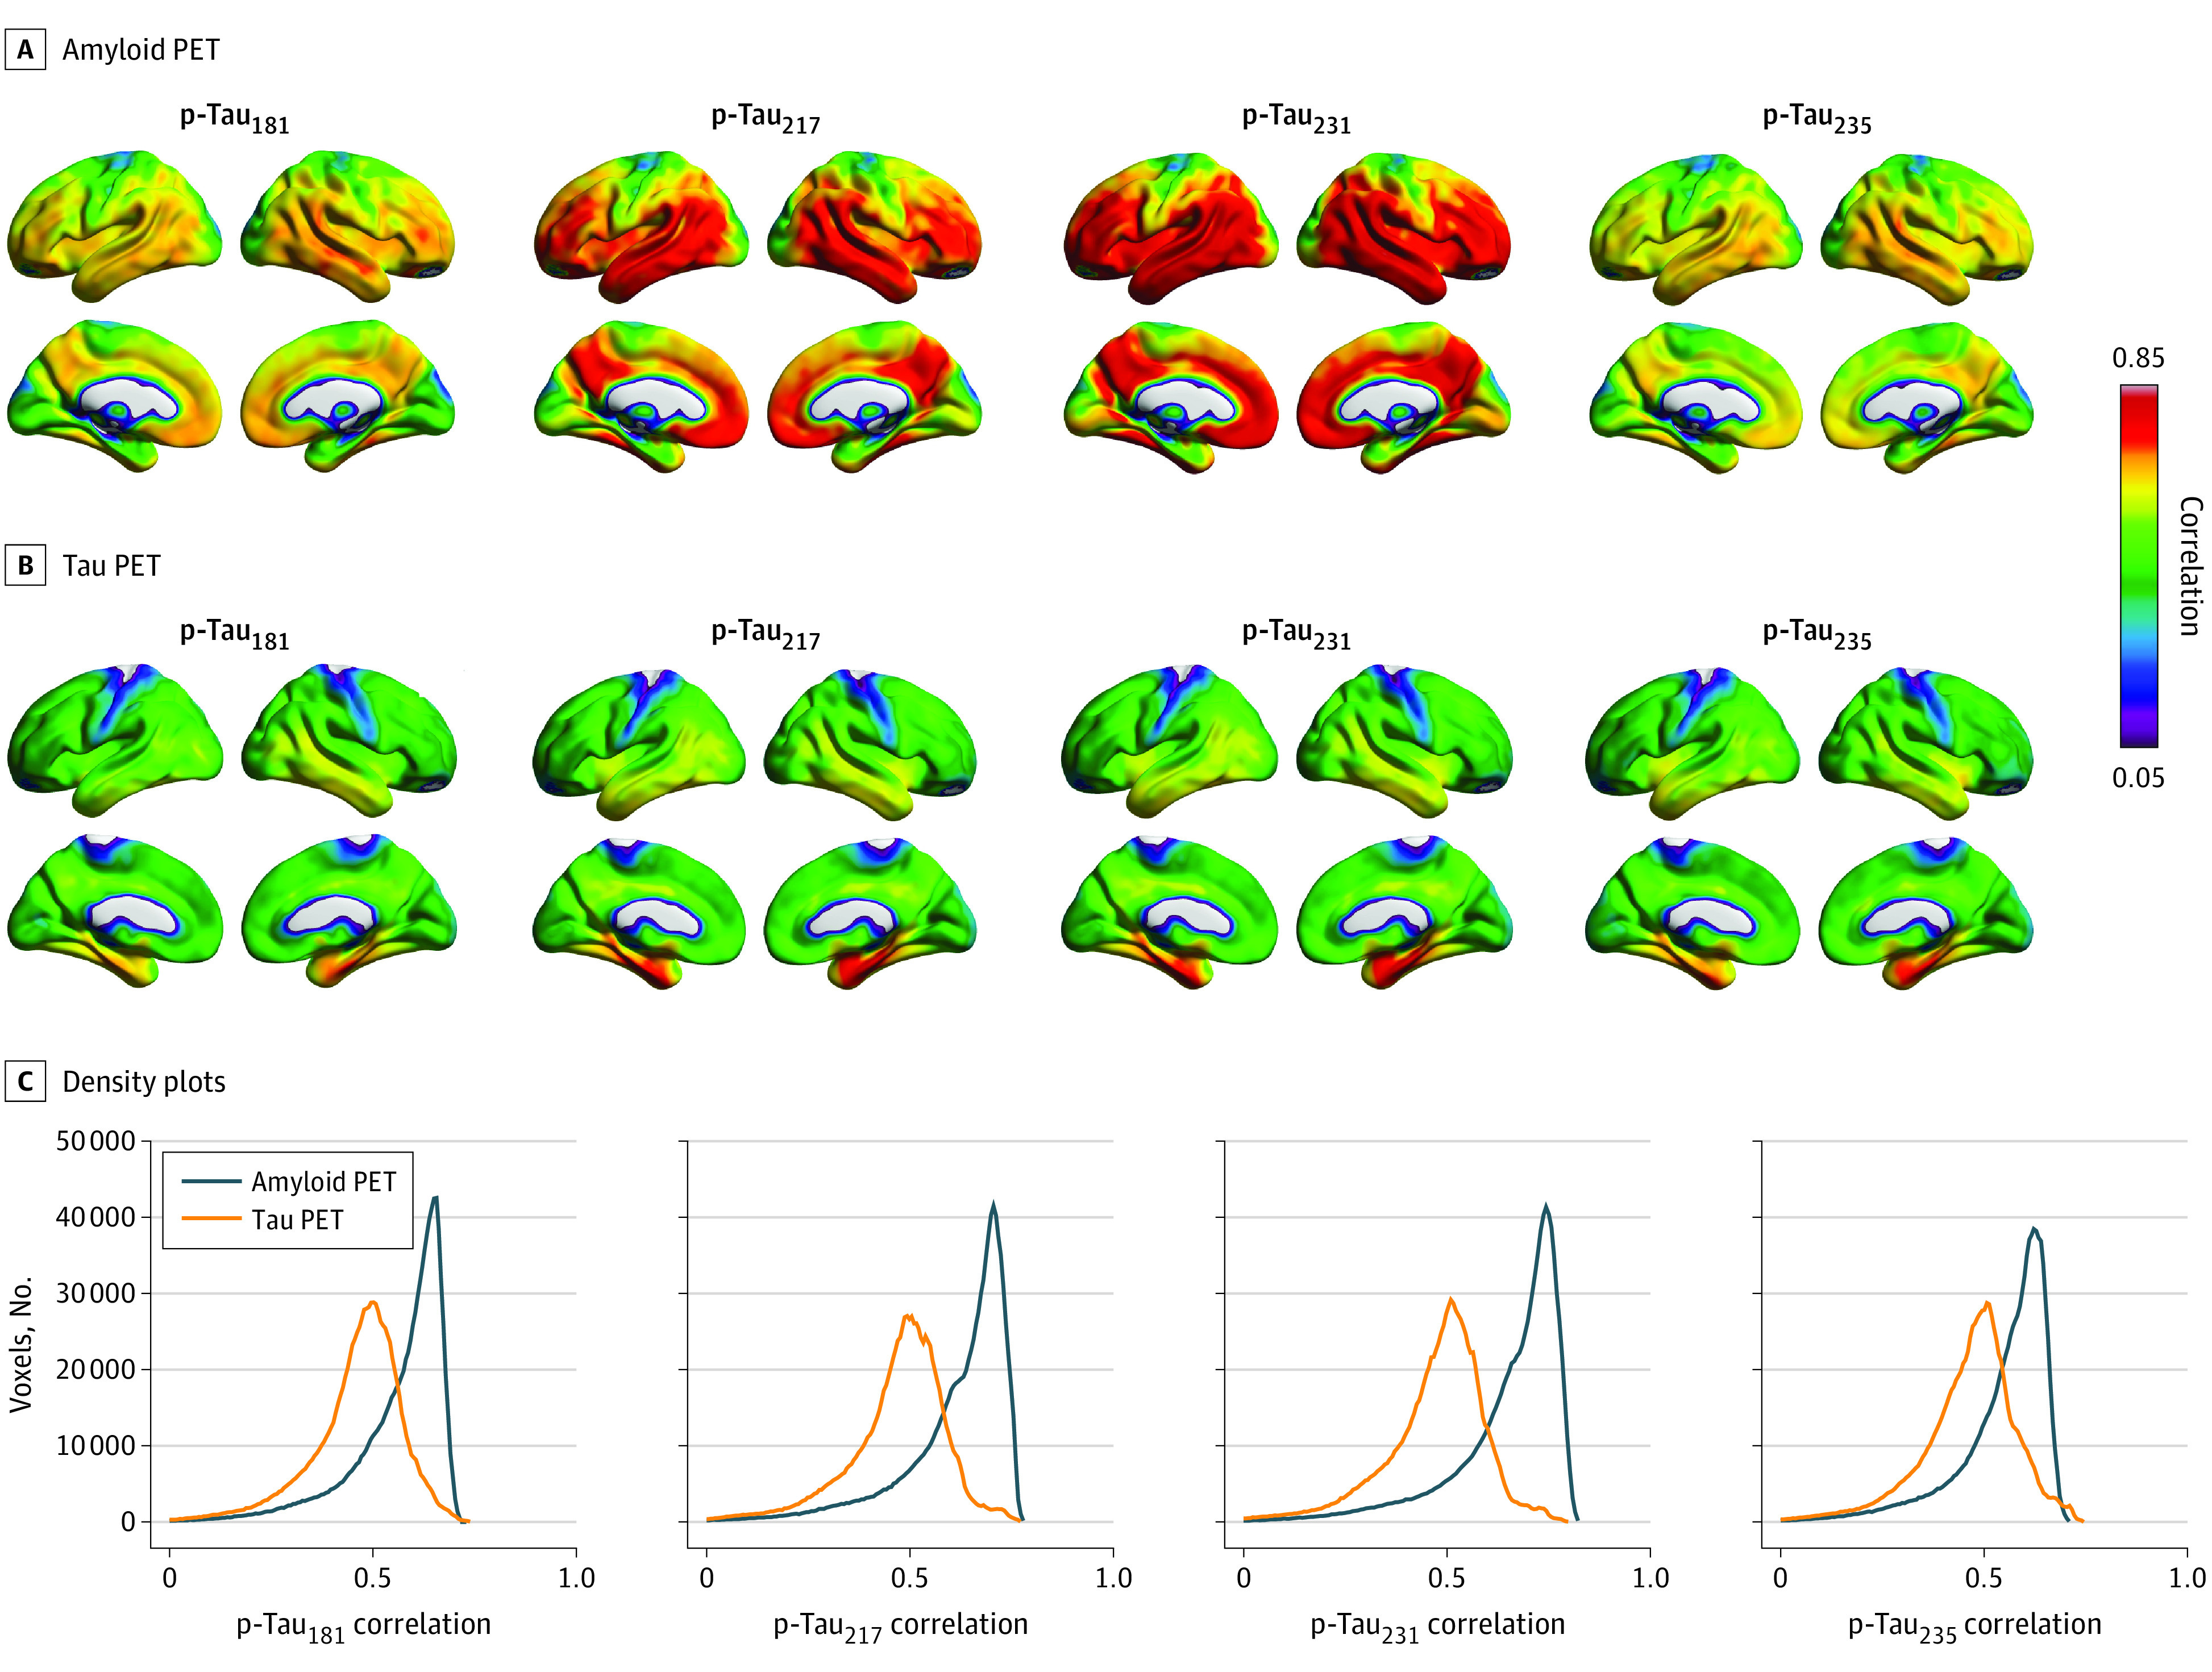
Figure 1. Association of Cerebrospinal Fluid (CSF) Phosphorylated Tau (p-Tau) Biomarkers With Amyloid Positron Emission Tomography (PET) and Tau PET Across the Cerebral Cortex.

Brain images show the distribution of associations between CSF p-tau biomarkers (p-tau181, p-tau217, p-tau231, and p-tau235) and [18F]AZD4694 amyloid PET (A) and [18F]MK6240 tau PET (B). C, Density plots depict the magnitude and frequency of the correlations in voxels per CSF p-tau epitope and imaging biomarker. For all CSF p-tau phosphorylation sites, most voxels had correlation values with amyloid PET between 0.65 and 0.75. In contrast, the majority of voxels had correlations around 0.50 with tau PET, with limited numbers of voxels having correlations between 0.65 and 0.75.
