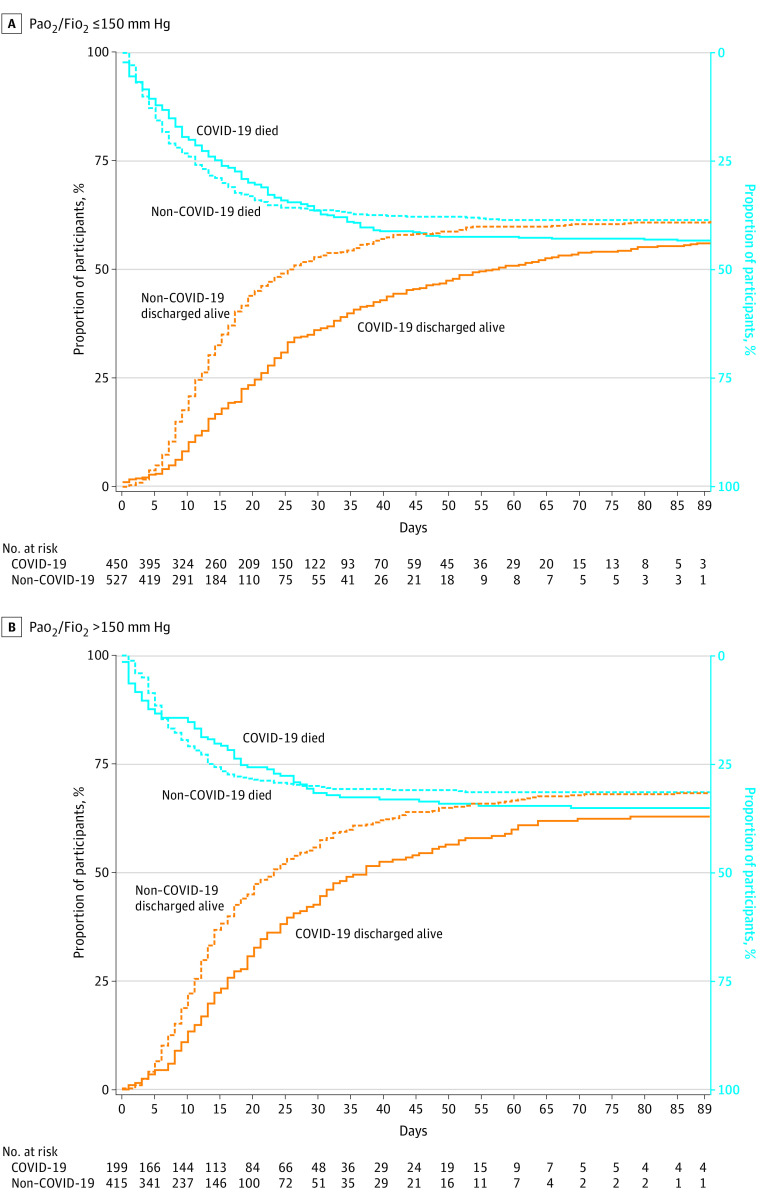
Figure 2. Cumulative Subdistribution Curves for Hospital Mortality and Discharge Home Alive at 90 Days Stratified by the Ratio of Partial Pressure Arterial Oxygen and Fraction of Inspired Oxygen (Pao2/Fio2) on the First Day of Mechanical Ventilation Before Propensity Score Adjustment.
This visual representation is based on unadjusted data. A, Hospital mortality at 90 days was not different for patients with COVID-19 compared with patients with non–COVID-19 (43% vs 39%; P = .57). Fewer patients with COVID-19 than non-COVID-19 were discharged alive at 90 days, but the difference was not statistically significant (56% vs 61%; P = .09). B, Hospital mortality at 90 days was not different for patients with COVID-19 compared with patients with non–COVID-19 (35% vs 32%; P = .70). Fewer patients with COVID-19 than non–COVID-19 were discharged alive at 90 days (63% vs 68%, P = .02).

