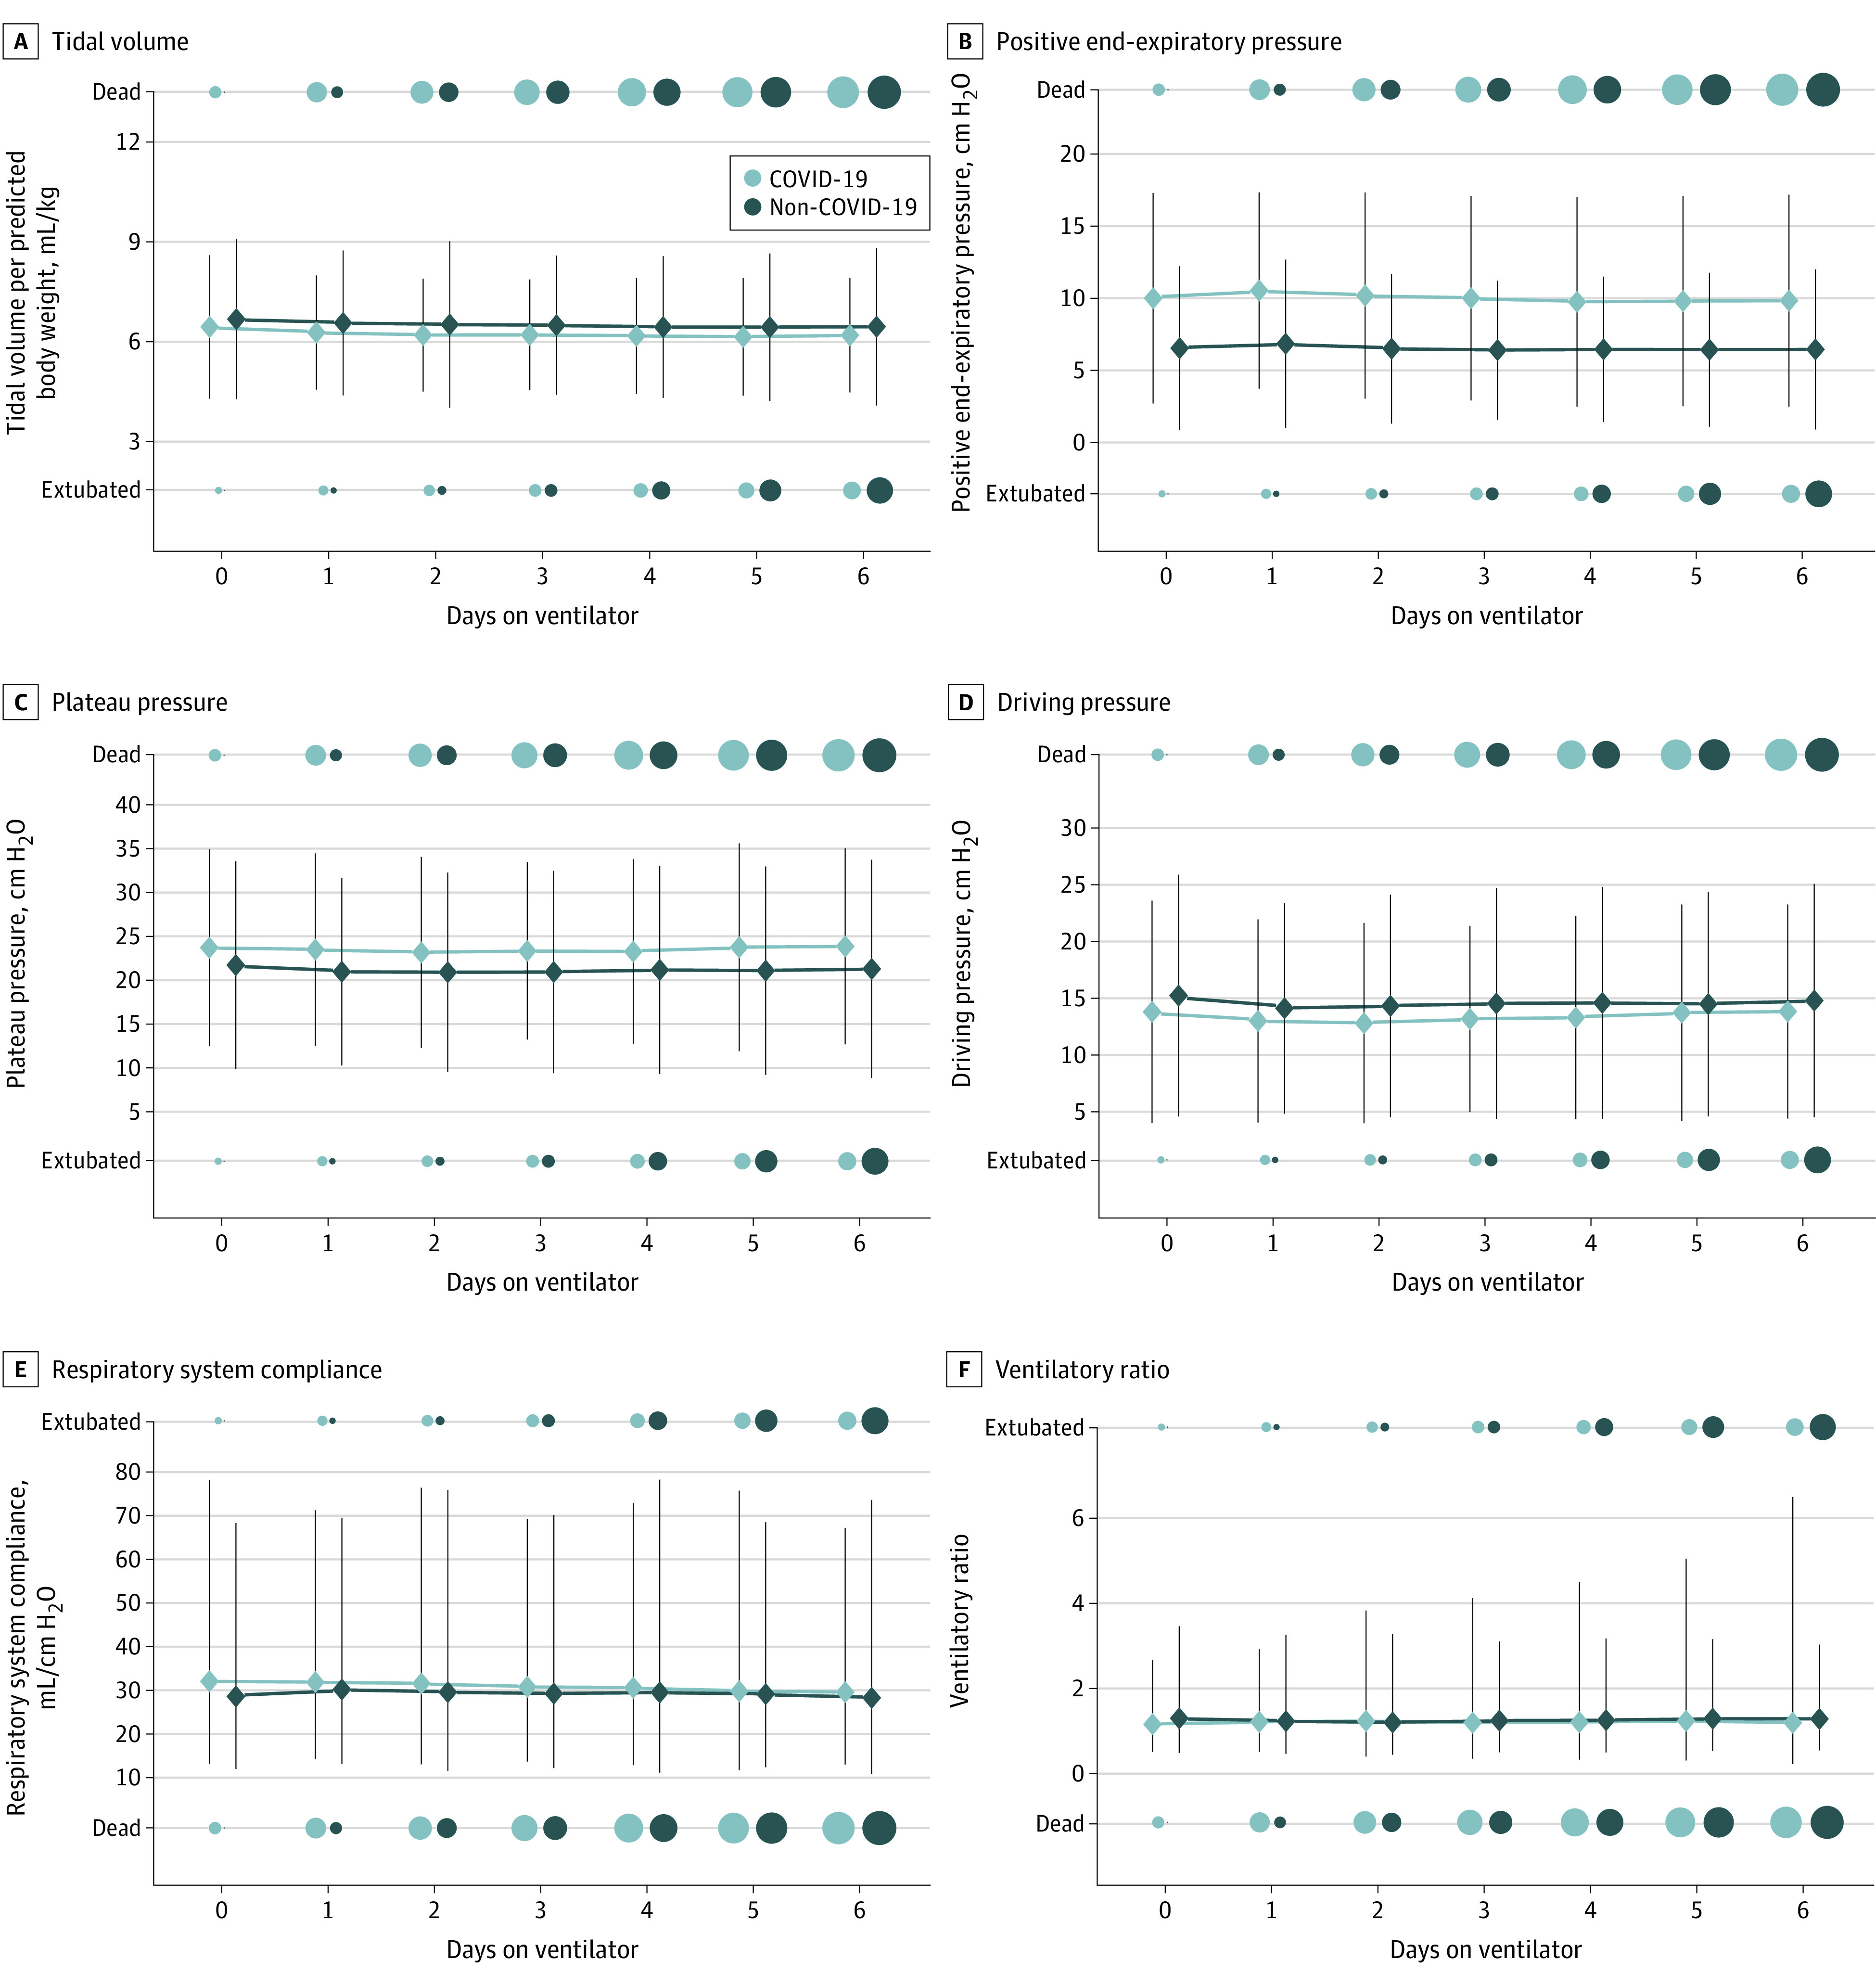
Figure 3. Mean Tidal Volume, Positive End-Expiratory Pressure, Plateau Pressure, Driving Pressure, Respiratory System Compliance, and Ventilatory Ratio for Patients With COVID-19 and Non–COVID-19 Pneumonia During the First Week of Mechanical Ventilation.

We plotted the mean (diamond) and 2 SDs (vertical line) of tidal volume per kilogram of predicted body weight (A), positive end-expiratory pressure (B), plateau pressure (C), driving pressure (D), respiratory system compliance (E), and ventilatory ratio (F) for patients with COVID-19 pneumonia and non–COVID-19 pneumonia for the first 7 days of mechanical ventilation. The number of patients who died or were extubated are represented using circles, with larger circles indicating a larger number of patients. Compared with patients with non–COVID-19, patients with COVID-19 received slightly lower tidal volumes and higher PEEP. Patients with COVID-19 also had slightly higher plateau and driving pressures, although overall these differences were small. Mean respiratory system compliance on the first day of mechanical ventilation was 32.0 mL/kg PBW/cm H2O for patients with severe COVID-19 and 28.4 mL/kg PBW/cm H2O for those with severe non–COVID-19 pneumonia (P < .001). Differences in mean respiratory system compliance were smaller on subsequent days. On the first day of mechanical ventilation, the mean ventilatory ratio was 1.2 for patients with severe COVID-19 pneumonia and 1.3 for those with severe pneumonia from other etiologies (P = .02). Differences in mean ventilatory ratio were even smaller on subsequent days.
