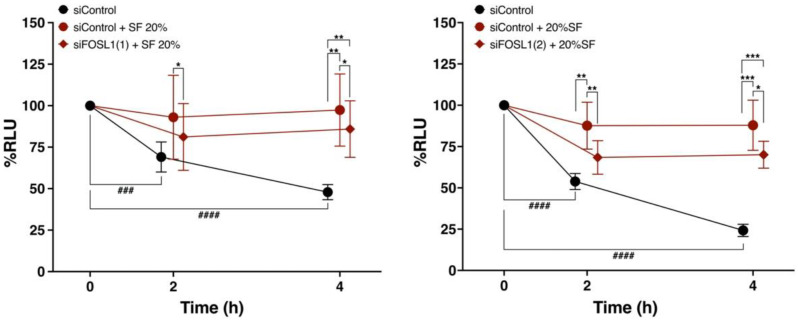
Figure 7.
Comparison of percent cell viability between FOSL1-knockdown ADSCs using two different FOSL1 siRNAs and the siControl group following SF treatment. Comparison of changes in percent cell viability over time between FOSL1-knockdown ADSCs and the siControl group following treatment with 20% SF from six Knee OA patients (n = 6). SF was diluted in saline. * p < 0.05, ** p < 0.01, *** p < 0.001, ### p < 0.001, #### p < 0.0001. Data are expressed as mean ± S.D.

