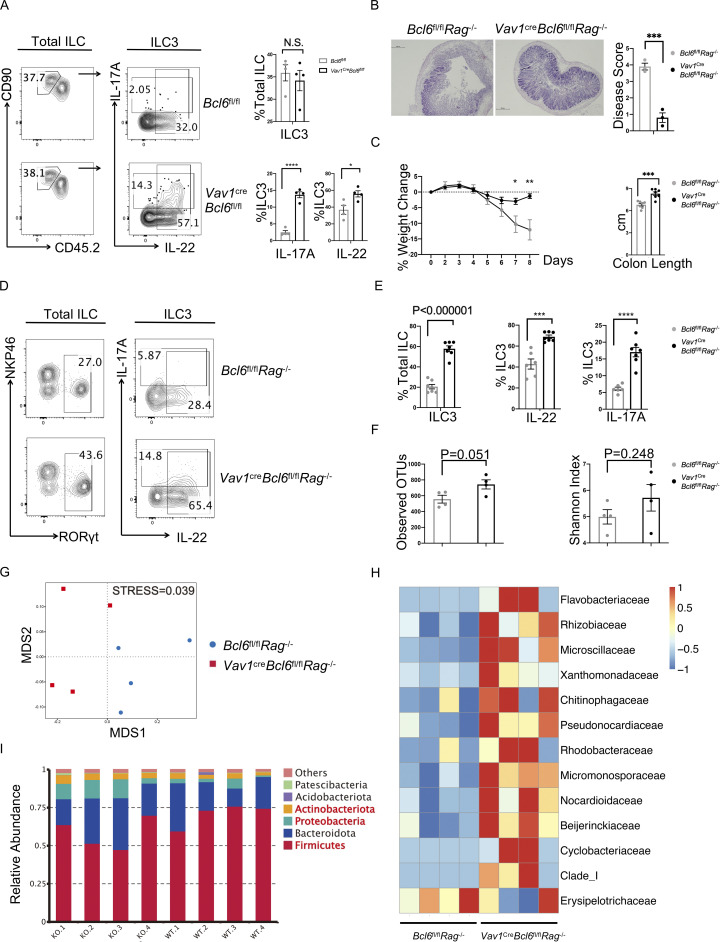
Figure 2.
Bcl6 deficiency in ILC3 enhances their cytokine expression and protect to DSS-induced colitis. (A) Expression and statistic data of IL-17A and IL-22 in total ILC3 obtained from the colon LPL of Vav1creBcl6fl/fl and Bcl6fl/fl littermates at steady state. Left: Gating strategy for total ILC3, IL-17A+ ILC3, and IL-22+ ILC3. Right: Statistic data for the percentages of ILC3 and IL-17A+ and IL-22+ ILC3. (B) H&E (left) and estimated disease scores (right) on colon sections from Vav1creBcl6fl/flRag1−/− mice and Bcl6fl/flRag1−/− littermates in DSS-induced colitis model. The scale bar indicates length of 200 μm. Also see Table S7 for details on disease score evaluation. (C) Weight changes of Vav1creBcl6fl/flRag1−/− mice and Bcl6fl/flRag1−/− littermates in DSS-induced colitis model (left). The statistics of colon length were shown on the right. (D) Expression of IL-17A and IL-22 in total ILC3 obtained from the colon LPL of Vav1creBcl6fl/flRag1−/− and Bcl6fl/flRag1−/− littermates in the DSS-induced colitis model in C. Left: Gating strategy for total ILC3. Right: IL-17A and IL-22 expression in ILC3. (E) Statistic data for the percentages of ILC3s (left) and IL-17A+ and IL-22 + ILC3 (right) in D. (F) The observed OTU numbers (left) and Shannon index of alpha diversity (right) for the 16 s rDNA-seq data derived from colonic fecal samples from Vav1creBcl6fl/flRag1−/− mice and Bcl6fl/flRag1−/− littermates. Raw data of 16s rDNA-seq are available through GSE220438 on GEO DataSets. (G) Non-metric Multi-dimensional Scaling (NMDS) plot for the 16 s rDNA-seq data in F. (H and I) Taxonomic analysis on relative beta diversity abundance for the 16 s rDNA-seq data in F. Comparison of enriched families with >2 significantly changed genera (H) and top 6 enriched phyla (I) between Vav1creBcl6fl/flRag1−/− mice and Bcl6fl/flRag1−/− littermates in each sample described in F and G. See also Table S4 for detailed list for differentially enriched phyla and families. Data are representatives of three (A and C–E) or two (B and F–I) independent experiments. Each dot in the bar charts represents a sample generated from an individual mouse. Data are shown as mean ± SEM. *P < 0.05, ***P < 0.001, ****P < 0.0001 by unpaired t test (A, B, C, E, and F).

