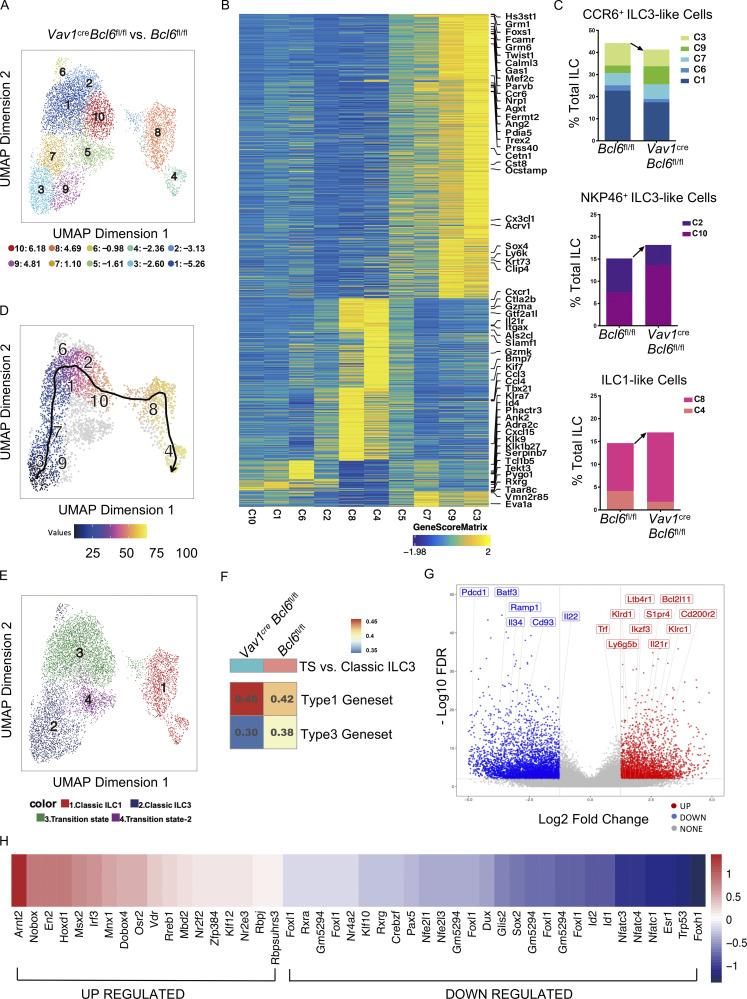
Figure 4.
scATAC-seq data reveals increased ILC3 plasticity in BCL6-deficient mice. The total intestinal ILC were obtained from the SI and colon LPL of Vav1creBcl6fl/fl or Bcl6fl/fl littermates (combination of three mice for each strain) by FACS sorting (gated on Lin−CD90+CD45+ live cells), and used for scATAC-seq analysis. UMAP visualizations for both Vav1creBcl6fl/fl and Bcl6fl/fl samples are visually identical, so all UMAP figures shown are representative data of one sample unless specifically indicated. Raw data of scATAC-seq are available through GSE221341 on GEO DataSets. (A) UMAP visualization of clustering pattern of the ILCs post deletion of ILC2 form cells from original scATAC-seq data pool (Fig. S5 A). Proportional changes of each cluster of Vav1creBcl6fl/fl versus Bcl6fl/fl littermate samples were labeled by blue-red colors with scales shown below. (B) Heatmap of marker genes (determined by gene score matrix) of each cluster (vertically labeled) of the total ILC2-depleted ILC in A. Selected ILC lineage specific genes (Gury-BenAri et al., 2016) with high gene scores in the 10 clusters were horizontally labeled on top (see also Table S5). (C) Frequencies of three subgroups from the total ILC2-depleted ILCs in A between Bcl6fl/fl and Vav1creBcl6fl/fl samples. Each subgroup is consisted of specified clusters (labeled by different colors) indicated by chromatin level characterization from B and Fig. S5 D. Arrow indicated direction of cell number changes. (D) Trajectory analysis for Bcl6fl/fl source clusters from A. See also Fig. S5 E for trajectory analysis result for Vav1creBcl6fl/fl sample. (E) Representative UMAP visualization of broad rename of cells from A. (F) GSVA of differential genesets generated by comparing chromatin accessibility of genes from TS vs. those from classic ILC3 for Vav1creBcl6fl/fl and Bcl6fl/fl samples, respectively. The overlapped genes between the two genesets were excluded from analysis (see also Table S5). (G) Volcano plot for Vav1creBcl6fl/fl source TS vs. classic ILC3 differential geneset generated in F. Selective regulated peaks (labeled by nearest gene) were Vav1creBcl6fl/fl-specific representatives matching literature ILC1 marker genes (right red, up-regulated) or CCR6+ ILC3 marker genes (left blue, down-regulated). See also Table S2 for literature marker genes and Table S6 for detailed information of selected peaks and nearby genes. (H) Transcription factor motif enrichment scores of Vav1creBcl6fl/fl TS vs. those of Bcl6fl/fl TS. The motifs shown here are selected by enrichment score of mlog10Padj >0.1. Value of score is labeled by blue-red color scale.

