Figure 5.
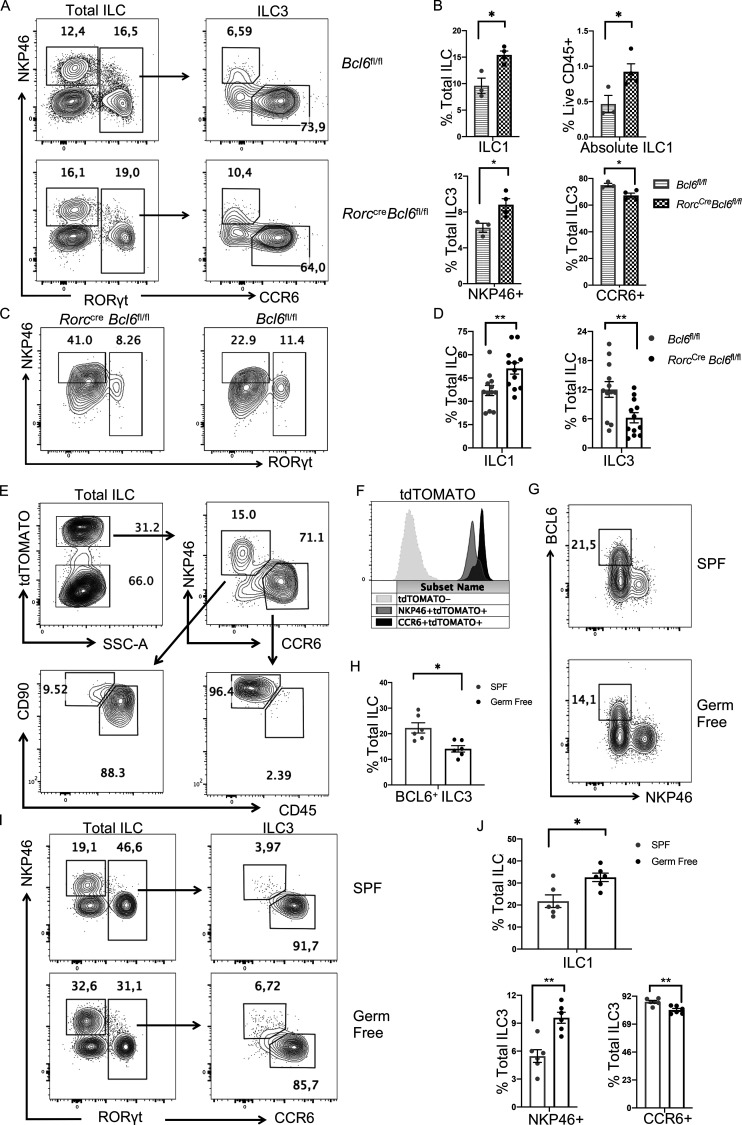
Microbiota restrain ILC3 to ILC1 plasticity through enhancing BCL6 expression. (A) Staining data of total ILC (left) and ILC3 (right) in the colon LPL of RorccreBcl6fl/fl mice and Bcl6fl/fl littermates at steady state. (B) Statistic data of indicated ILC populations in A. (C) Staining data of total ILCs showing ILC1 and ILC3 populations for donor CCR6+ ILC3s obtained from RorccreBcl6fl/fl and Bcl6fl/fl littermates 25 d following transfer into M-NSG recipient mice. (D) Statistic data of indicated ILC populations in C. (E) Staining pattern of CCR6+ and NKP46+ ILCs in tdTOMATO fated ILCs obtained from colon LPL of Tamoxifen treated Bcl6ERT2creRosatdtomato fate mapping mice. (F) Representative expression of tdTOMATO for indicated ILC subsets in E. (G) BCL6 staining data in total ILC obtained from colon LPL from SPF and germ-free mice. (H) Statistic data for the percentages of BCL6+ ILC3 within total ILCs from SPF and germ-free mice in G. (I) Staining pattern of total ILC and ILC3 in SPF and germ-free mice in G. (J) Statistic data for the percentages of ILC1, NKP46+ ILC3, and CCR6+ ILC3 in SPF and germ-free mice in G. Data are representative of three (A, B, E, and F), or combined from three (C and D) or two (G, H, I, and J) independent experiments. Each dot in the bar charts represents a sample generated from an individual mouse. Data with significance are shown as mean ± SEM. *P < 0.05, **P < 0.01 by unpaired t test (B, D, H, and J).

