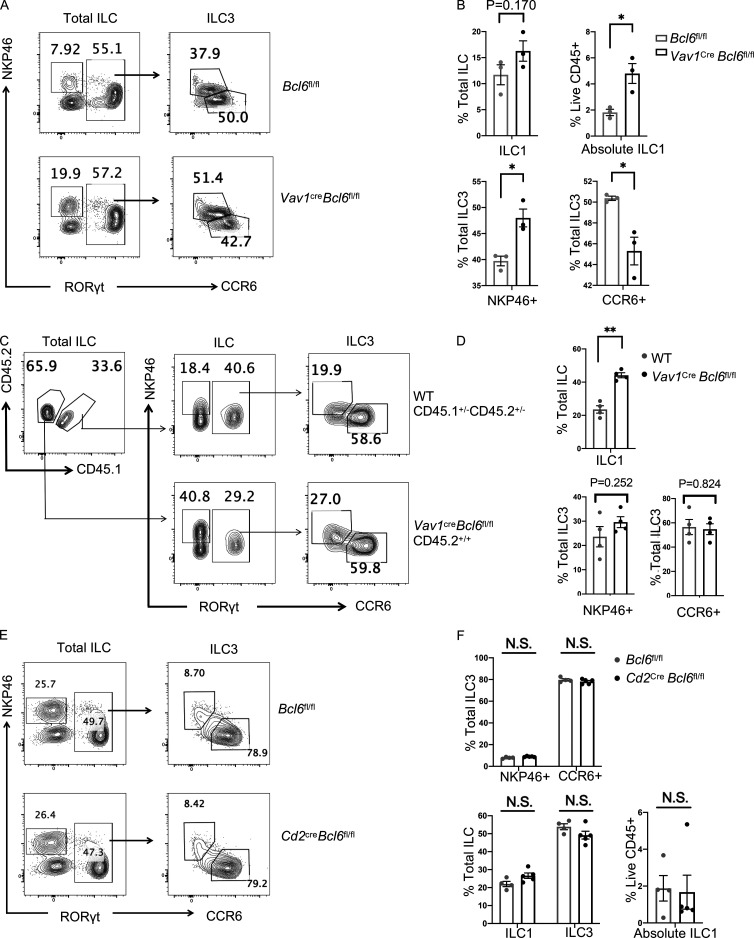
Figure S3.
Intrinsity-related analysis of ILC1/ILC3 ratio alterations in Vav1creBcl6fl/fl mice (relative to Fig. 3). (A) Staining data of total ILCs (left) and ILC3s (right) in the SI LPL of Vav1creBcl6fl/fl mice and Bcl6fl/fl littermates at steady state. (B) Statistic data for the percentages of ILC1, NKP46+ ILC3, and CCR6+ ILC3 in A. (C) Staining data of ILC and ILC3 of indicated donor origins in the SI LPL obtained from the lethally irradiated B6 (CD45.1+/+) mice mentioned in Fig. 3, D−F. (D) Statistic data for the percentages of ILC1, NKP46+ ILC3, and CCR6+ ILC3 from the chimeric mice in C. (E) Staining pattern of total ILC and ILC3 populations obtained from colon LPL of Cd2CreBcl6fl/fl mice and Bcl6fl/fl littermates at steady state. (F) Statistic data for percentages of indicated ILC subsets in A. Data are a representative of three (A and B) and two (C–F) independent experiments. Each dot in the bar charts represents a sample generated from an individual mouse. Data are shown as mean ± SEM. *P < 0.05, **P < 0.01 by unpaired t test (B, D, and F).

