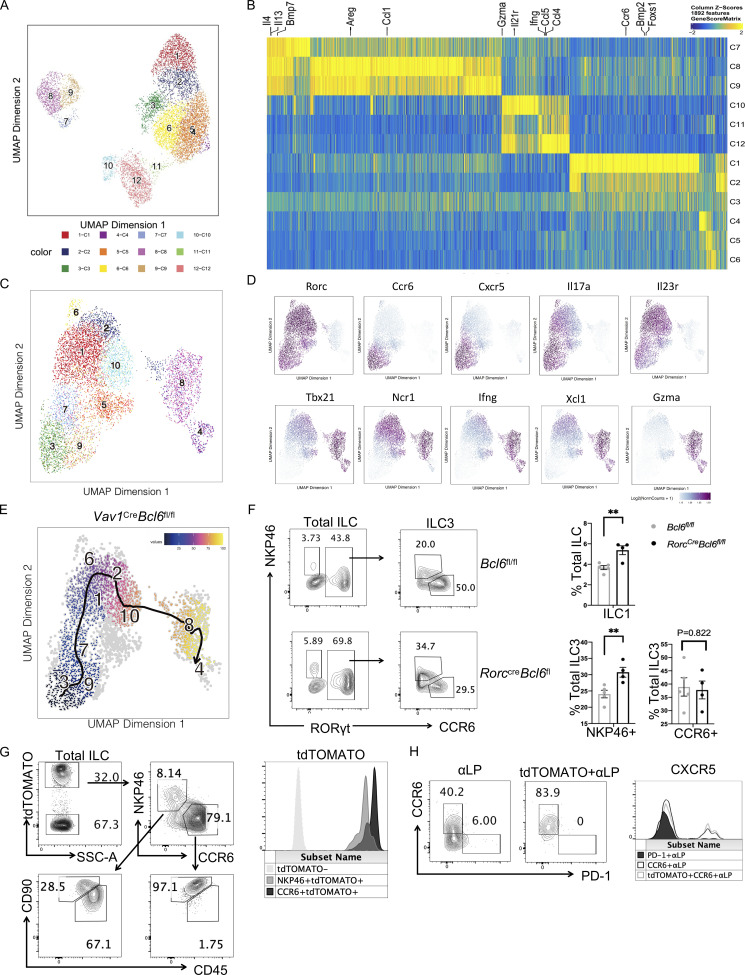
Figure S5.
Supplemental data of scATAC-seq as well as phenotypes in RorccreBcl6fl/fl mice and Bcl6ERT2creRosatdtomato mice (relative to Fig. 4 and Fig. 5). (A) UMAP visualization of the scATAC-seq (Fig. 4) clustering pattern of the total intestinal ILC from colon and SI LPL of Vav1creBcl6fl/fl mice or Bcl6fl/fl littermates. (B) Heatmap of marker genes (determined by gene score matrix) of each cluster (vertically labeled) of the total ILC in A. Selected ILC lineage specific genes (Gury-BenAri et al., 2016) with high gene scores in the 12 clusters were horizontally labeled on top (see also Table S5). (C) UMAP visualization of clustering pattern of the ILC post deletion of ILC2 form cells from original scATAC-seq data pool in A. (D) UMAP distribution of relative chromatin accessibility of indicated genes for cells in C, represented by color with scale bar (Log2 = 1.15–1.30). (E) Trajectory analysis of Vav1creBcl6fl/fl source clusters shown in C. (F) Staining data of total ILC and ILC3 (left) in the SI LPL of RorccreBcl6fl/fl mice and Bcl6fl/fl littermates at steady state. Statistic data of indicated ILC populations were shown (right). (G) Staining pattern (left) of CCR6+ and NKP46+ ILCs in tdTOMATO fated ILCs obtained from SI LPL of Bcl6ERT2creRosatdtomato fate mapping mice mentioned in Fig. 5, E and F. Expression of tdTOMATO for indicated ILC subsets were shown (right). (H) Staining pattern (left) of CCR6+ and PD-1+ αLP (Lin− IL-7R+α4β7+) in total or tdTOMATO fated BMs obtained from Tamoxifen treated Bcl6ERT2creRosatdtomato fate-mapping mice. Expression of CXCR5 for indicated cell types were shown (right). Data are a representative of three (F–G) or two (H) independent experiments. Each dot in the bar charts represents a sample generated from an individual mouse. Data are shown as mean ± SEM. **P < 0.01 by unpaired t test (F).

