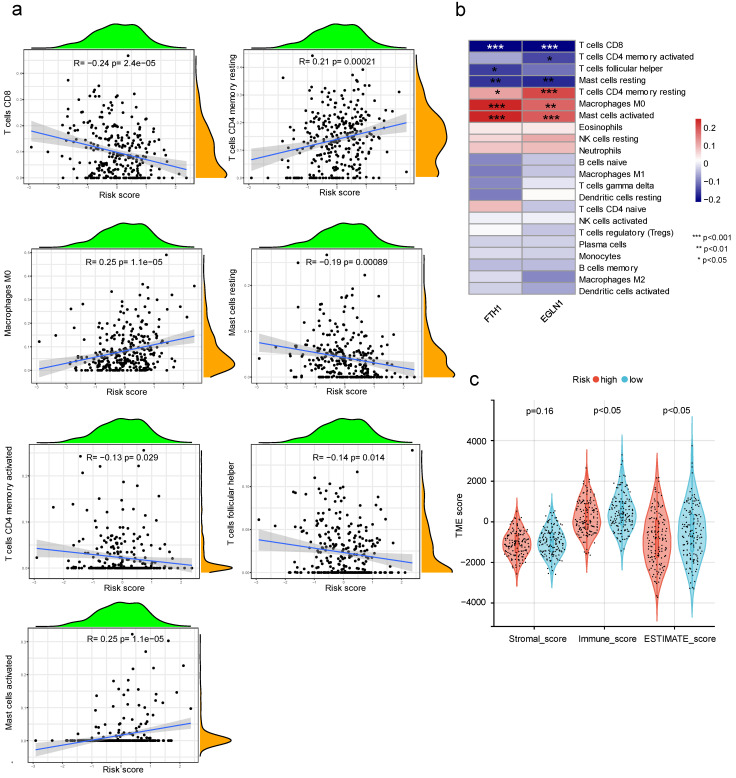
Figure 9.
Relationship between risk score and immune infiltration. (a) Analysis of immune cell types associated with risk score (R represents Pearson correlation coefficient; p represents the significance levels); (b) heatmap of correlation between expression levels of FTH1 and EGLN1 and immune cells; and (c) immunity scores observed within different groups of risk scores. (p < 0.05 *; p < 0.01 **; p < 0.001 ***).

