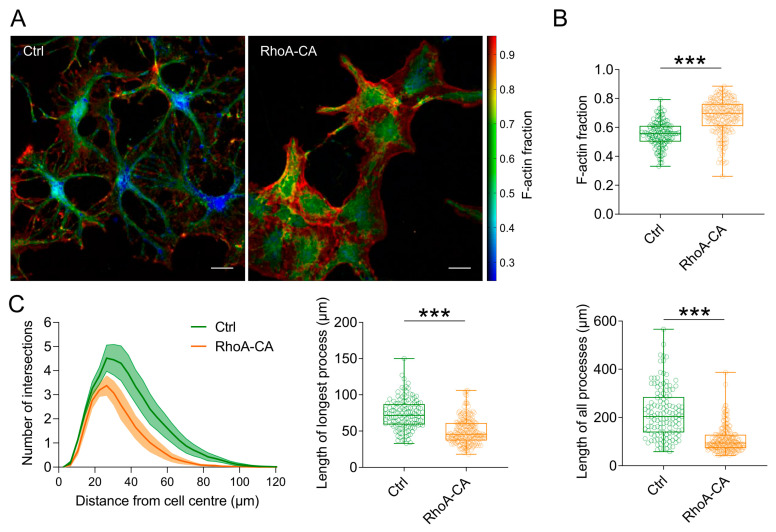
Figure 2.
Astrocytic expression of RhoA-CA increases the F-actin fraction in vitro. (A) Representative images of cultured mouse hippocampal astrocytes expressing tdTomato (Ctrl, AAV-hGFAP-tdTomato) or RhoA-CA and tdTomato (AAV-hGFAP-tdTomato-RhoA-CA) stained for filamentous and globular actin structures (F-/G-actin). Displayed is the color-coded F-actin fraction (F-actin/(F-actin + G-actin)) (scale bars 20 µm). (B) Increased F-actin fraction in astrocytes expressing RhoA-CA (0.67 ± 0.12) compared to control cells (0.55 ± 0.09, Mann–Whitney U-test, p < 0.001). (C) Sholl analysis shows a reduced number of processes, defined by the number of intersections, in astrocytes expressing RhoA-CA. Area under the curve (AUC, left panel) was reduced in RhoA-CA (AUC 105 ± 8.4) compared to the control experiments (AUC 186 ± 12.1; unpaired Student’s t-test, p = 0.0015). Overexpression of RhoA-CA reduced the mean length of the longest processes (middle panel; Ctrl: 73.3 ± 20.6 µm; RhoA-CA: 49.6 ± 17.5 µm; Mann–Whitney U test, p < 0.001) and the total length of all processes (right panel; Ctrl: 219.0 ± 103.0 µm; RhoA-CA: 108.1 ± 52.4 µm; Mann–Whitney U test, p < 0.001). For (B,C), four independent cultures were analysed (Ctrl: n = 132 cells; RhoA-CA: n = 210 cells). Box and Whisker plots: box indicates the 25th and 75th percentiles, the whiskers the minimum and maximum values, the horizontal line in the box the median, and hollow circles on top the individual data points. *** indicates p ≤ 0.001.

