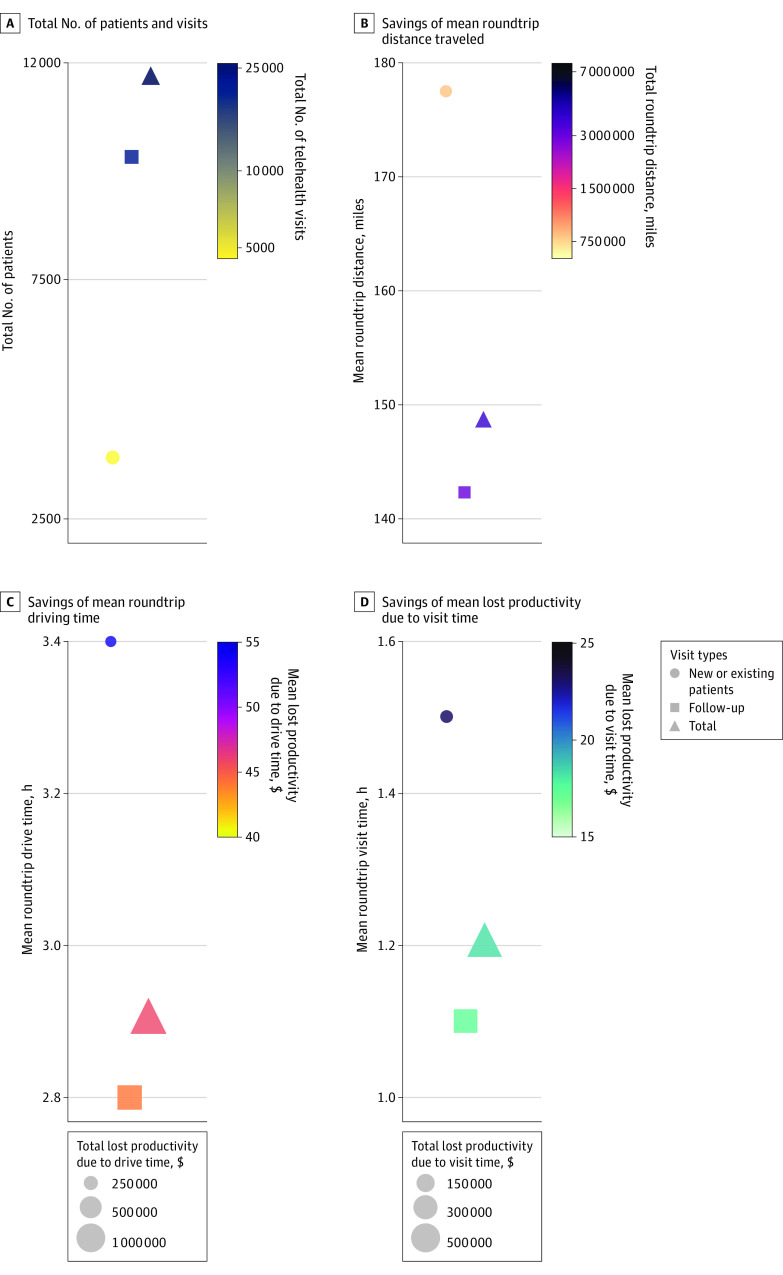
Figure 2. Estimated Total Number of Visits, Roundtrip Drive Time, Roundtrip Distance, Total and Mean Lost Productivity Due to Drive Time, and Total and Mean Lost Productivity Due to Visit Time.
A, Total number of patients and visits. B, Savings of mean roundtrip distance traveled. Color represents the total roundtrip distance saved for all patients. C, Savings of mean roundtrip driving time. Color represents the mean lost productivity due to driving time; the size of the marker represents total lost productivity due to drive time. D, Savings of mean lost productivity due to visit time. Color represents the mean lost productivity due to visit time; the size of the marker represents total lost productivity due to visit time.

