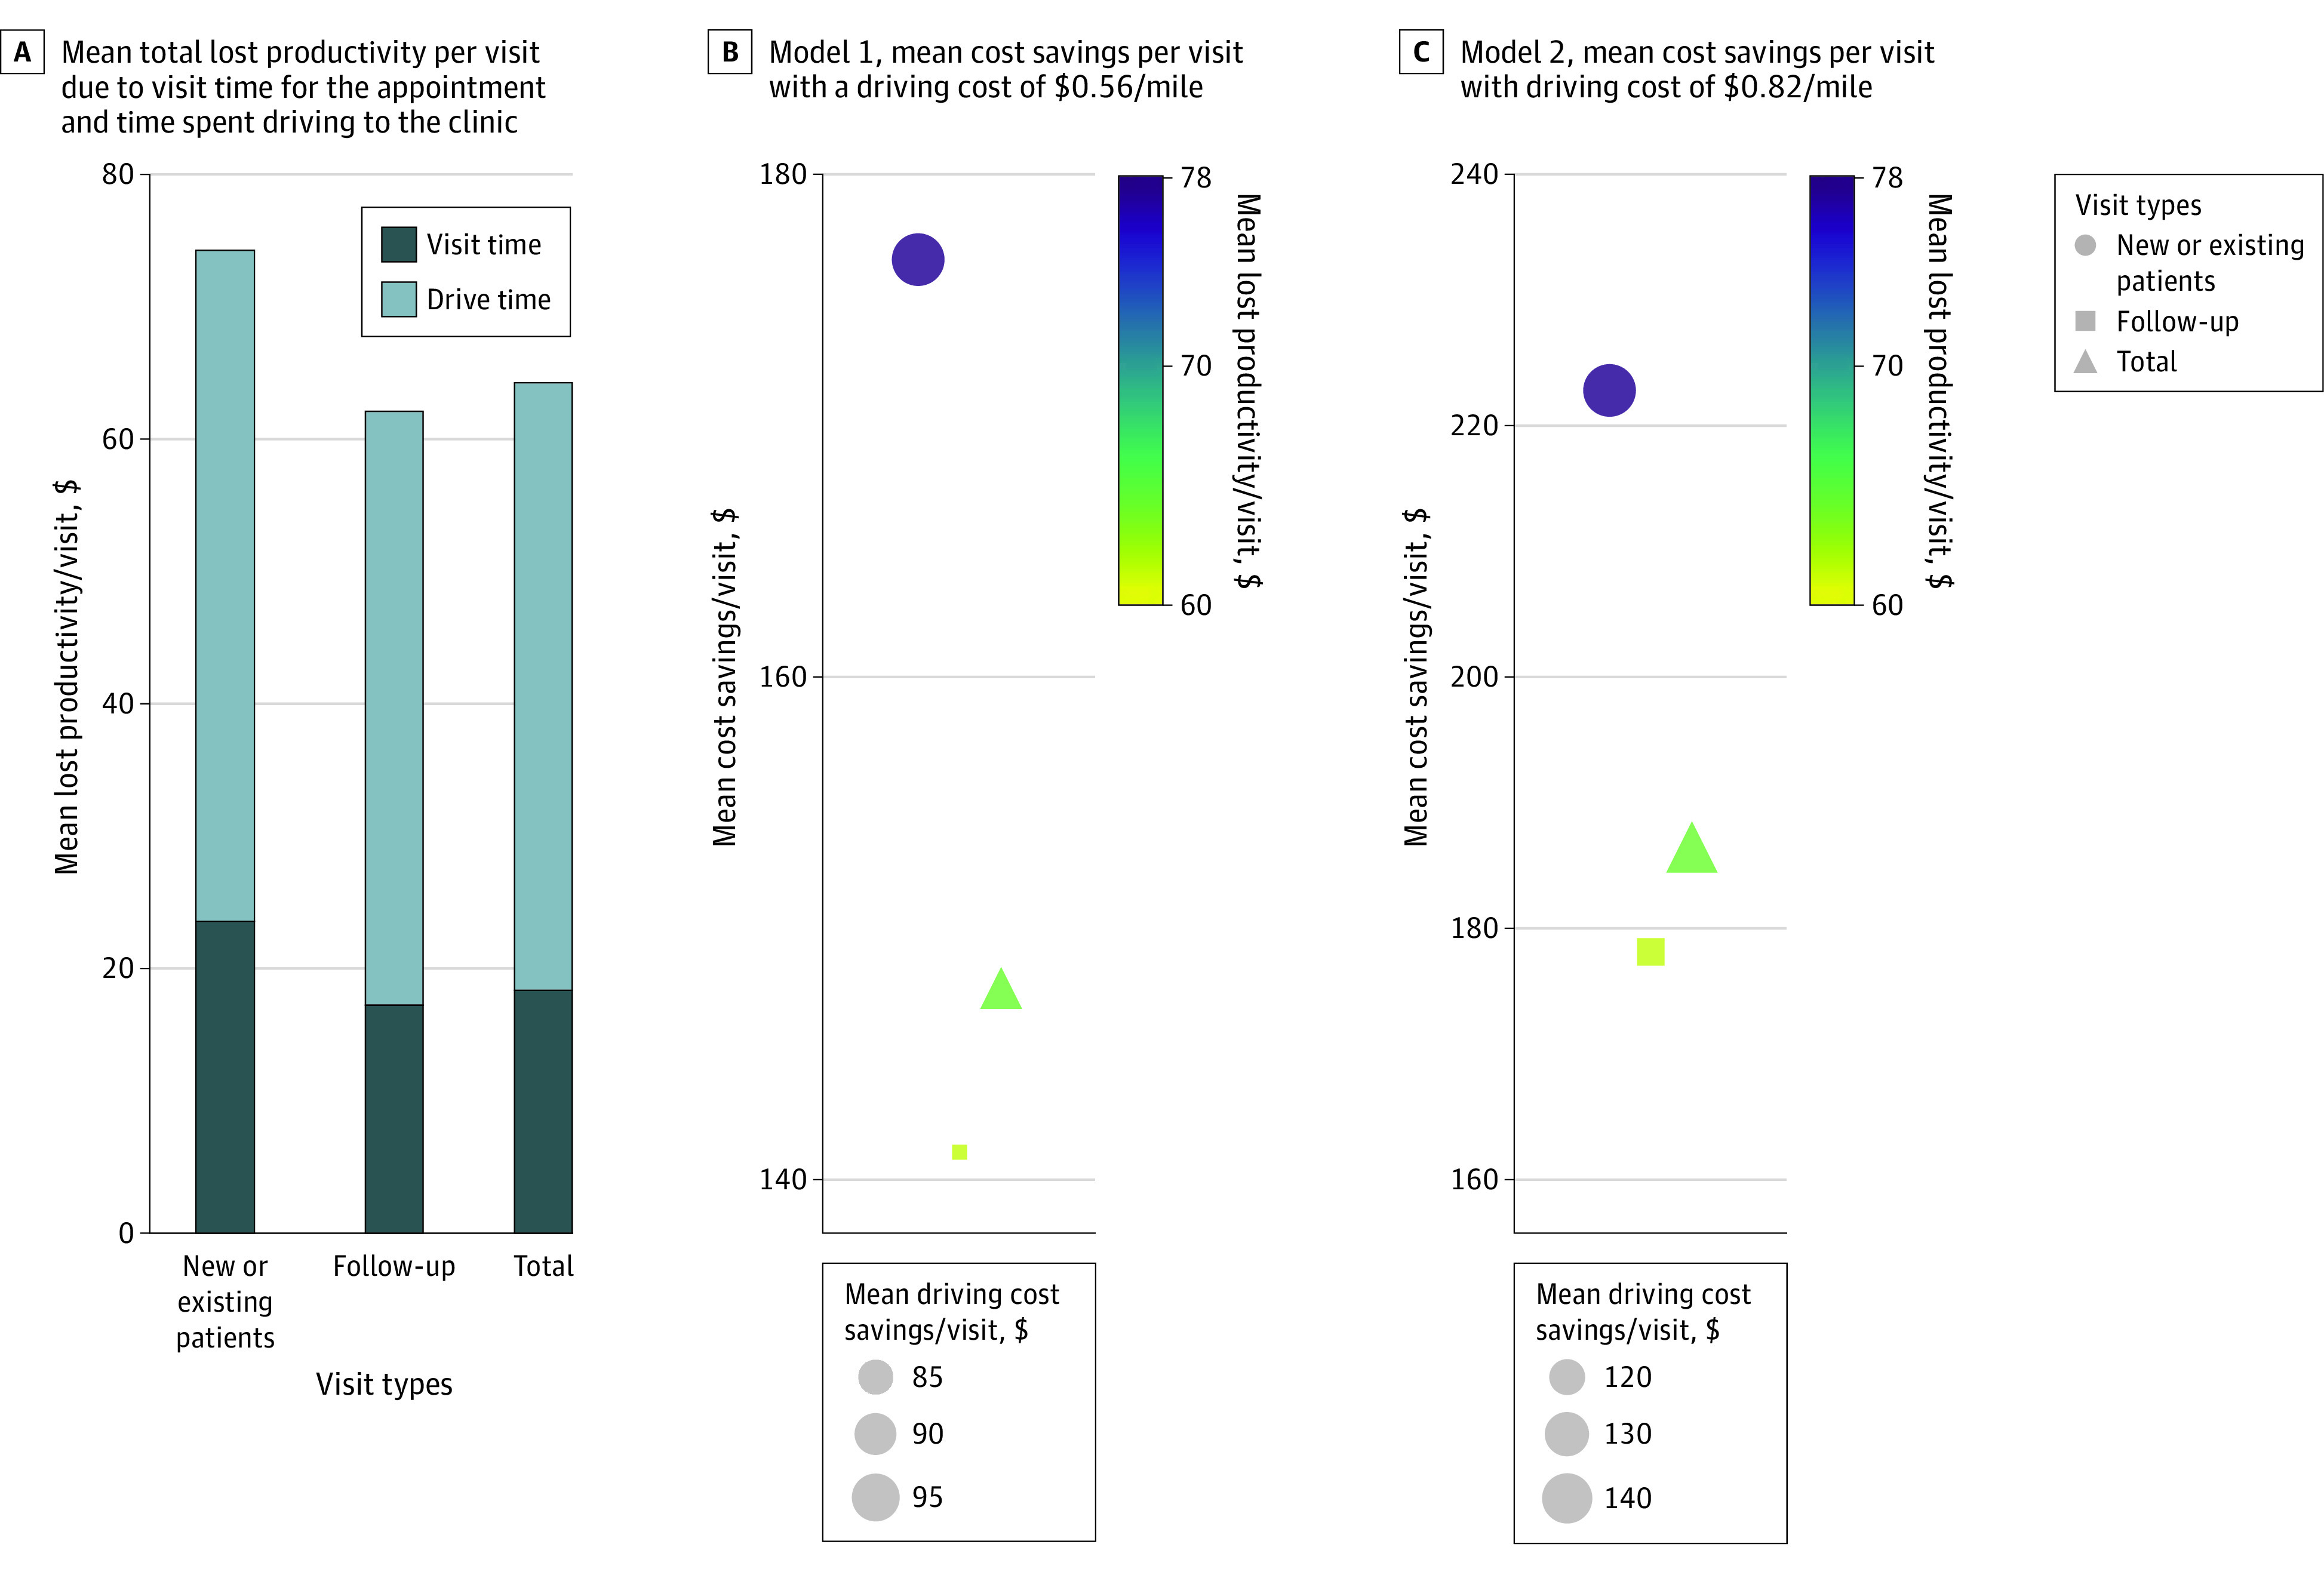
Figure 3. Projected Cost Savings of Virtual Visits Seen at Moffitt Cancer Center From April 1, 2020, to June 30, 2021.

Two different models were used with a range of costs per mile ($0.56/mile and $0.82/mile). A, Mean total lost productivity per visit due to visit time for the appointment and time spent driving to the clinic. B, Model 1, mean cost savings per visit with a driving cost of $0.56/mile. Color represents mean savings from lost productivity per visit (due to the visit time and driving time), and the size of the marker represents mean driving cost savings/visit. C, Model 2, mean cost savings per visit with driving cost of $0.82/mile. Color represents mean savings from lost productivity per visit (due to visit time and driving time) and the size of the marker represents the mean driving cost savings per visit.
