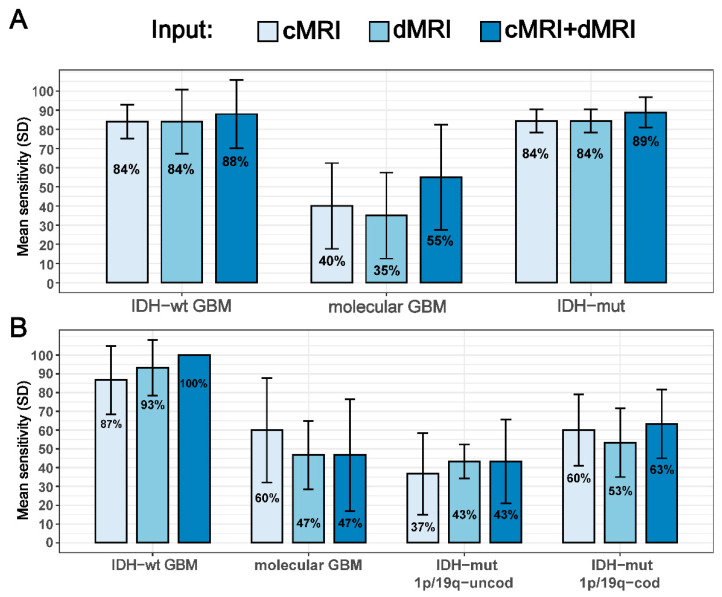
Figure 4.
Individual molecular subtype prediction performance of the networks using different MR images as inputs for two tasks in the second round of analysis that included glioblastomas: (A) IDH status prediction and (B) three-group molecular subtype prediction. The numbers within the coloured bars are the average sensitivities over the five test sets in the outer loop and the vertical black bars represent the corresponding standard deviations. cMRI = conventional MRI; dMRI = diffusion MRI; IDH-wt = IDH-wildtype; GBM = glioblastoma; IDH-mut = IDH-mutant; 1p/19q-cod = 1p/19q-codeleted; 1p/19q-uncod = 1p/19q-uncodeleted.

