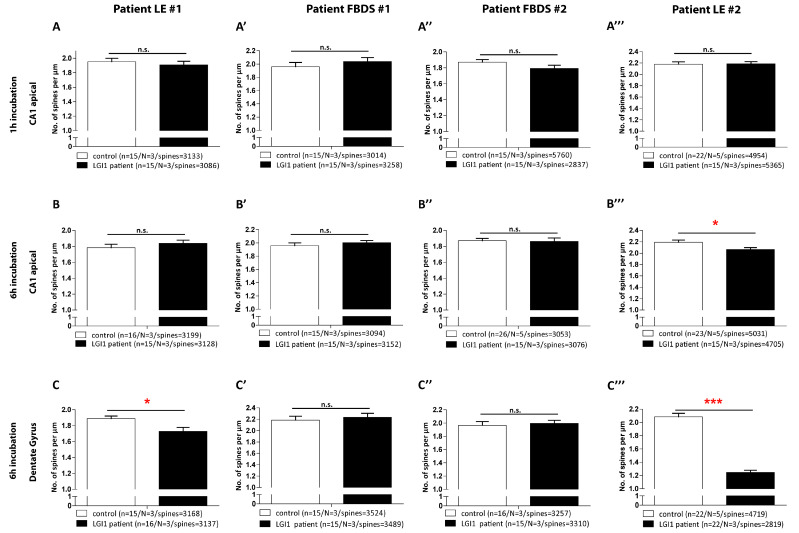
Figure 4.
Quantified spine density after short and long ab application in CA1 and DG. Comparable spine density at apical second or third-order dendritic branches of CA1 pyramidal cells after 1 h (A,A’,A’’,A’’’) application of individual LGI1 IgG and 6 h (B,B’,B’’,B’’’). Only 6 h treatment with IgGs of patient LE#2 reduced spine density (p = 0.015) (C,C’,C’’,C’’’). Spine numbers at granular dendrites after 6 h incubation with individual IgG caused a reduction in spine density for patient LE#1 (p = 0.014 and #4 p < 0.001). Data presented as mean ± SEM, n = number of dendrites, N = number of animals, spines = number of total spines. Significant results are marked with a red asterisk. * = p < 0.05, *** = p < 0.01, n.s. = not significant.

