Figure 1.
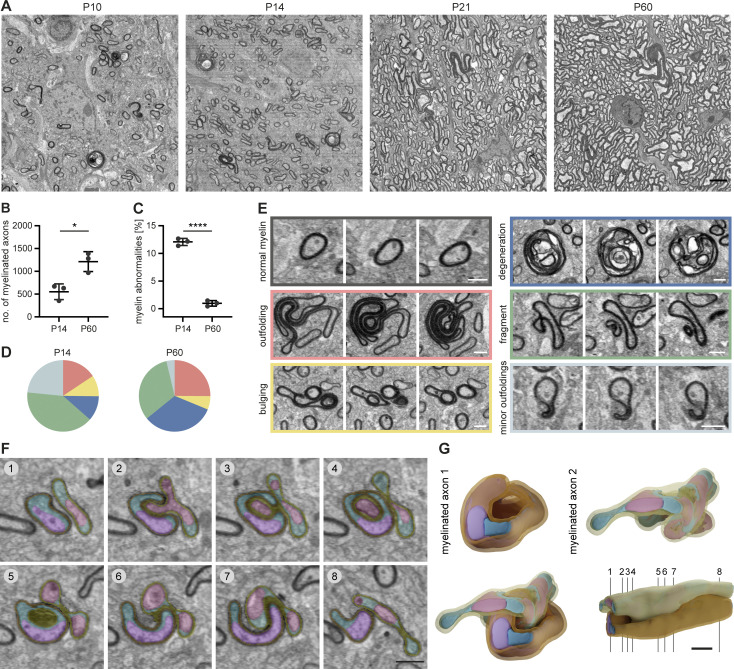
Myelin abnormalities occur temporarily during development in the mouse CNS. SBF-SEM of P10, P14, P21, and P60 wt mouse optic nerves (80 × 80 × 40–210 μm volumes with a 10 × 10 × 80 nm resolution). (A) Representative cross-sections. (B) Mean number of myelinated axons within a 40 × 40 μm area at P14 and P60 (quantified on 8–10 evenly dispersed cross-sections within the SBF-SEM volumes, n = 3 optic nerves). Two-sided Student’s t test: *, P = 0.0145. In total, we quantified 4,655.3 ± 785.4 myelinated axons at P14 and 10,560 ± 2,099.8 at P60. (C) Mean percentage of myelin abnormalities at P14 and P60 (within 8–10 evenly dispersed volumes of 40 × 40 × 8 μm, normalized by the number of myelinated axons in reference sections, n = 3 optic nerves). Two-sided Student’s t test: ****, P < 0.0001. (D) Percentage of error subtypes among the myelin errors quantified in C: outfoldings (red), bulgings (yellow), degenerations (dark blue), fragments pinching off from a sheath or lying in the vicinity of a sheath (green), and minor outfoldings (light blue). Means of n = 3 optic nerves. Color code refers to example images in E. (E) Cross-sections at different z levels show examples of myelin abnormalities: outfolding, bulging, degeneration, fragment detaching from an intact sheath, and minor outfoldings that likely represent an early stage of outfolding and bulging. (F and G) 3D reconstruction of a myelinated axon bulging into another myelinated axon. (F) Pseudo-colored cross-sections at different z levels (violet/pink: axons, petrol/cyan: glial cytoplasm, orange/yellow: myelin). Note the excess glial cytoplasm at the location of bulging. (G) 3D reconstruction. Numbering refers to cross-sections in F. Images in A and F are 4 × 4 binned. Scale bars: 3 µm (A), 2 µm (G), 1 µm (E, F). See also Videos 1 and 2.

