Figure 2.
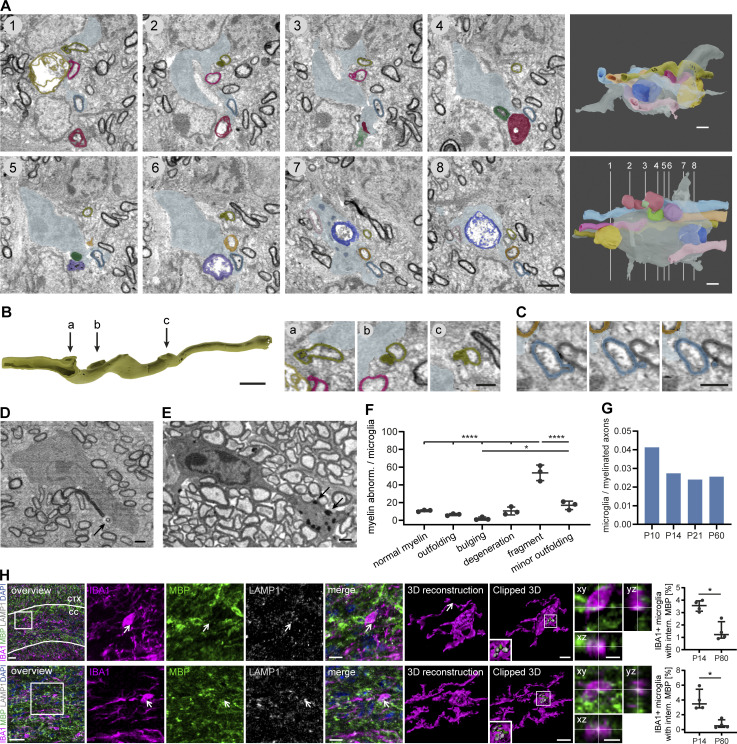
Microglia engulf and phagocytose developmental myelin abnormalities in the mouse CNS. (A−D) SBF-SEM of a P14 wt mouse optic nerve shows a microglia contacting several myelinated axons with aberrant myelin ultrastructure. (A) Pseudocolored cross-sections show examples of myelin abnormalities engulfed or contacted by a microglia. The microglia is displayed in gray blue, while the other colors designate individual myelin sheaths. 3D reconstructions (right) show different orientations and numbering refers to cross-sections. (B) Focal myelin dystrophies on a reconstructed myelin sheath. The dystrophy in “a” is sliced to display the 3D structure. Arrows refer to cross-sections on the right side. Cross-sections show details of the cross-sections 1, 2, and 6 in A. (C) Myelin fragment pinching off a myelin sheath on three consecutive sections. (D) Microglia engulfing a detached myelin fragment (arrow). (E) Microglia with myelin inclusions at P60 (arrows). (F) Quantification shows the percentage of myelin aberration subtypes associated with microglia in SBF-SEM of P14 wt mouse optic nerves (n = 3 mice). One-way ANOVA with post-hoc Tukey’s test: normal myelin, outfoldings, bulgings, degeneration, and minor outfolding vs. fragment: P < 0.0001, bulging vs. minor outfolding: P = 0.0165, all other comparisons were non-significant. (G) Quantification shows the total number of microglia within a volume of 80 × 80 × 160 µm normalized by the number of myelinated axons at P10, P14, P21, and P60 (n = 1 optic nerve). (H) Sections of P14 wt corpus callosum (CC; top), cortex (CTX), and optic nerve (bottom) co-immunostained for MBP and LAMP1 together with IBA1 for microglia. Clipped 3D view shows MBP-positive staining inside microglia and in close association with lysosomes (arrows). Orthogonal views display co-localization of IBA1 and MBP staining. Quantifications show the percentage of microglia with internalized MBP in P14 vs. P80 brains (n = 4 mice). Mann–Whitney U-test: P = 0.0286 (H, corpus callosum and optic nerve). Data represent median and IQR. *, P < 0.05, ****, P < 0.0001. Images in A–E are 4 × 4 binned. Scale bars: 30 μm (H, overview), 10 μm (H, merge), 5 μm (H, clipped 3Ds and orthogonal views), 2 μm (A, B, 3D reconstruction), and 1 μm (B, cross-sections, C–E). See also Video 3.

