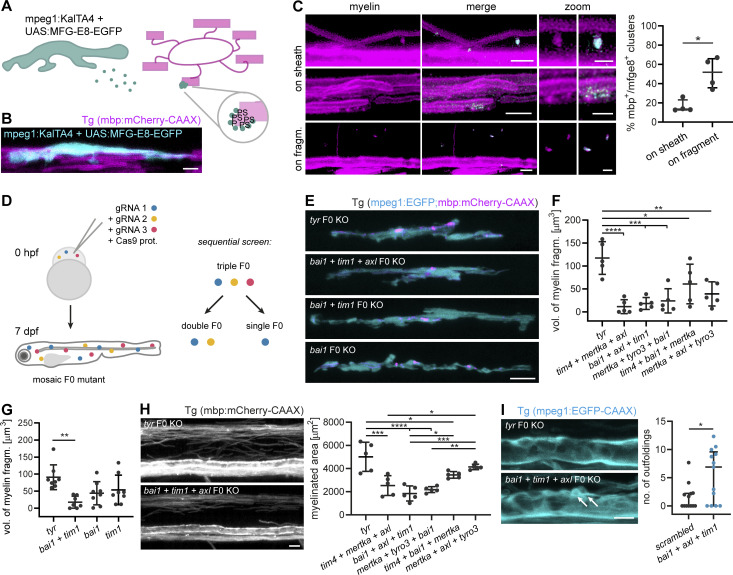
Figure 4.
PS recognition contributes to myelin phagocytosis. (A) Scheme depicting the in vivo detection of PS, as performed in B and C. Microglia secrete MFG-E8-EGFP, which binds to PS exposed on the extracellular leaflet of the membrane. In compacted myelin membranes, extracellular exposure of PS is sterically hindered, but may occur due to structural abnormalities of the myelin sheath. (B) A microglial cell expressing MFG-E8-EGFP contacts mbp:mCherry-CAAX–positive myelin sheaths. (C) Images show binding of MFG-E8-EGFP (cyan) to myelin sheaths or fragments (magenta) in Tg (mbp:mCherry-CAAX) larvae. In the top row “on sheath” images, MFG-E8-EGFP labeled several protuberances on two myelin sheaths; the relative amounts of labeled structures in these images are not representative of the quantification. Images are masked by the 552 nm channel. Zoomed images show details of myelin (left) and merged (right) images. Quantifications show the percentage of MFG-E8-EGFP–labeled structures that exhibited mbp:mCherry-CAAX co-staining, categorized by their localization on myelin sheaths or mbp:mCherry-CAAX–positive fragments (n = 4 larvae). Data represent median with IQR. Mann–Whitney U-test: P = 0.0286. (D) Schematic of the CRISPR/Cas9 F0 mutant screen for PS receptors. Fertilized Tg (mpeg1:EGFP; mbp:mCherry-CAAX) zebrafish eggs were injected with Cas9-gRNA RNP complexes at one-cell stage. F0 larvae were assessed at 7 dpf for myelin phagocytosis by microglia. We performed a sequential screen, starting with triple mutants and further dissecting one of them into double and single mutants. (E) Representative images of single, double, and triple mutants of bai1, tim1, and axl. Tyr F0 mutant was used as a control. (F) Quantification shows the total volume of myelin fragments within all microglia in different triple mutants (n = 5 larvae). One-way ANOVA with post-hoc Tukey’s test: tyr vs. tim4+bai1+mertka: P = 0.0462, tyr vs. mertka + axl + tyro3: P = 0.0028, tyr vs. mertka + tyro3+bai1: P = 0.0004, tyr vs. bai1+axl + tim1: P = 0.0002, tyr vs. tim4+mertka + axl: P < 0.0001, all other comparisons were non-significant. (G) Quantification shows the total volume of myelin fragments within all microglia in double and single mutants of bai1 and tim1 (n = 7 larvae for bai1+tim1, n = 8 larvae for tyr, bai1, and tim1). One-way ANOVA with post-hoc Tukey’s test: tyr vs. bai1+tim1: P = 0.0019, all other comparisons were non-significant. (H) Example images and quantification show the myelinated area of the dorsal spinal cord of 7 dpf triple mutants (n = 5 larvae). One-way ANOVA with post-hoc Tukey’s test: tyr vs. tim4+bai1+mertka: P = 0.0187, tim4+mertka + axl vs. mertka + axl + tyro3: P = 0.0145, bai1+axl + tim1 vs. tim4+bai1+mertka: P = 0.0151, mertka + tyro3+bai1 vs. mertka + axl + tyro3: P = 0.0022, tyr vs. tim4+mertka + axl: P = 0.0001, bai1+axl + tim1 vs. mertka + axl + tyro3: P = 0.0003, tyr vs. bai1+axl + tim1 and tyr vs. mertka + tyro3+bai1: P < 0.0001, all other comparisons were non-significant. (I) Maximum projections of wt and bai1;axl;tim1 mutant Tg (mbp:EGFP-CAAX) ventral spinal cords showing myelin outfoldings budding off the Mauthner axon (arrows). Quantification of the number of myelin abnormalities in 10 dpf ventral spinal cord of wt and bai1;axl;tim1 larvae, normalized by the myelinated area (n = 13 larvae). Mann-Whitney U-test: P = 0.0362. Data represent median and IQR (C and I) and means ± SD (F–H). *, P < 0.05, **, P < 0.01, ***, P < 0.001, ****, P < 0.0001. Scale bars: 10 µm (E and H), 5 µm (B and C, merge, I), 2 µm (C, zoom).

