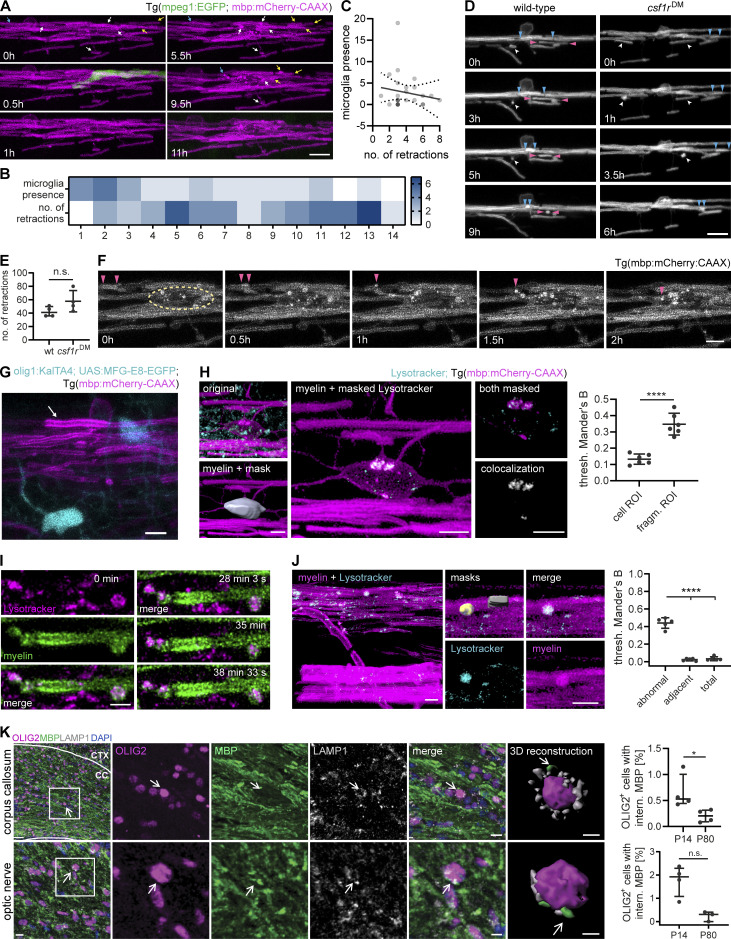
Figure 5.
Oligodendrocytes retract myelin sheaths independent of microglia and degrade membrane fragments. (A−C) Time-lapse confocal imaging of 3 dpf wt Tg (mpeg1:EGFP; mbp:mCherry-CAAX) zebrafish spinal cord is used to analyze retractions of dorsal myelin sheaths with respect to microglial presence. Images were acquired every 30 min during 14 h. (A) Representative images. Arrows identify individual retractions by color and the position of the arrowheads. A microglia contacting myelin sheaths was only observed during a single frame (at 0.5 h). (B) Heatmap shows microglial presence and the number of retractions in 5 × 5 mm quadrants along the dorsal spinal cord (1 to 12, anterior to posterior). (C) XY plot correlates the number of time frames, in which a microglia was present, with the number of myelin sheath retractions in 26 oligodendrocyte territories (n = 5 larvae). Linear regression analysis: R2: 0.02556, P = 0.4453. Dotted lines represent the standard error of the linear regression. (D and E) Time-lapse confocal imaging of 3 dpf wt and csf1rDM;Tg (mbp:EGFP-CAAX) larvae. Images (D) were acquired every 30 min over 8 h. Arrowheads identify individual retractions by different colors. Quantification in E shows the number of retractions during 8 h. Mann-Whitney U-test: P = 0.1429. (F) Time-lapse confocal imaging from A shows how retractions result in bright fragments inside the oligodendrocyte cell body. Arrowheads mark a retracting sheath and its fragments. Dashed circle indicates the oligodendrocyte soma. (G) Example of a retracting sheath (arrow) exhibiting normal ultrastructure and lacking MFG-E8-EGFP labeling in a 4 dpf Tg (mbp:mCherry-CAAX) spinal cord with transient expression of olig1:KalTA; UAS:MFG-E8-EGFP. (H) Colocalization analysis of mbp:mCherry-CAAX–positive fragments inside oligodendrocyte cell bodies with LysoTracker Green. Oligodendrocyte cell bodies were manually segmented from the 552 nm channel. Channels were masked by the whole cell body (cell ROI) or by the bright mbp:mCherry-CAAX fragments inside (fragment ROI), followed by colocalization analysis. Thresholded Mander’s B coefficient reflects the amount of colocalization within the ROI of the thresholded 552 nm channel (43 cell bodies from n = 6 larvae). Student’s t test: P < 0.0001. (I) Time-lapse imaging of a single myelin sheath stained in vivo with LysoTracker Red (maximum projections). Z-stacks were acquired every 3 s. (J) Quantification of LysoTracker colocalization with structural myelin abnormalities compared to a normal-appearing adjacent myelin sheath and total myelin in the same image (n = 5 larvae). One-way ANOVA with post-hoc Tukey’s test: abnormal vs. adjacent, abnormal vs. total: P < 0.0001, adjacent vs. total: P = 0.9074. (K) Free-floating sections of P14 wt mouse brains co-immunostained for MBP and LAMP1 together with OLIG2 for oligodendrocytes. Top row: corpus callosum, bottom row: optic nerve. 3D reconstruction shows MBP-positive staining in close association with lysosomes (marked by arrow) and the oligodendrocyte nucleus. Quantifications show the percentage of oligodendrocytes with internalized MBP in P14 vs. P80 brains (n = 4 mice). Mann–Whitney U-test: P = 0.0286 (corpus callosum), P = 0.0571 (optic nerve). Data represent means ± SD (H and J) and median and IQR (E and K). n.s., not significant, *, P < 0.05, ****, P < 0.0001. Scale bars: 30 µm (K, corpus callosum overview), 10 µm (A, D, K, optic nerve overview and corpus callosum merge), 5 µm (F, G, H, J, K, optic nerve merge), 3 µm (H, clipped 3Ds), 2 µm (I). See also Video 5.

