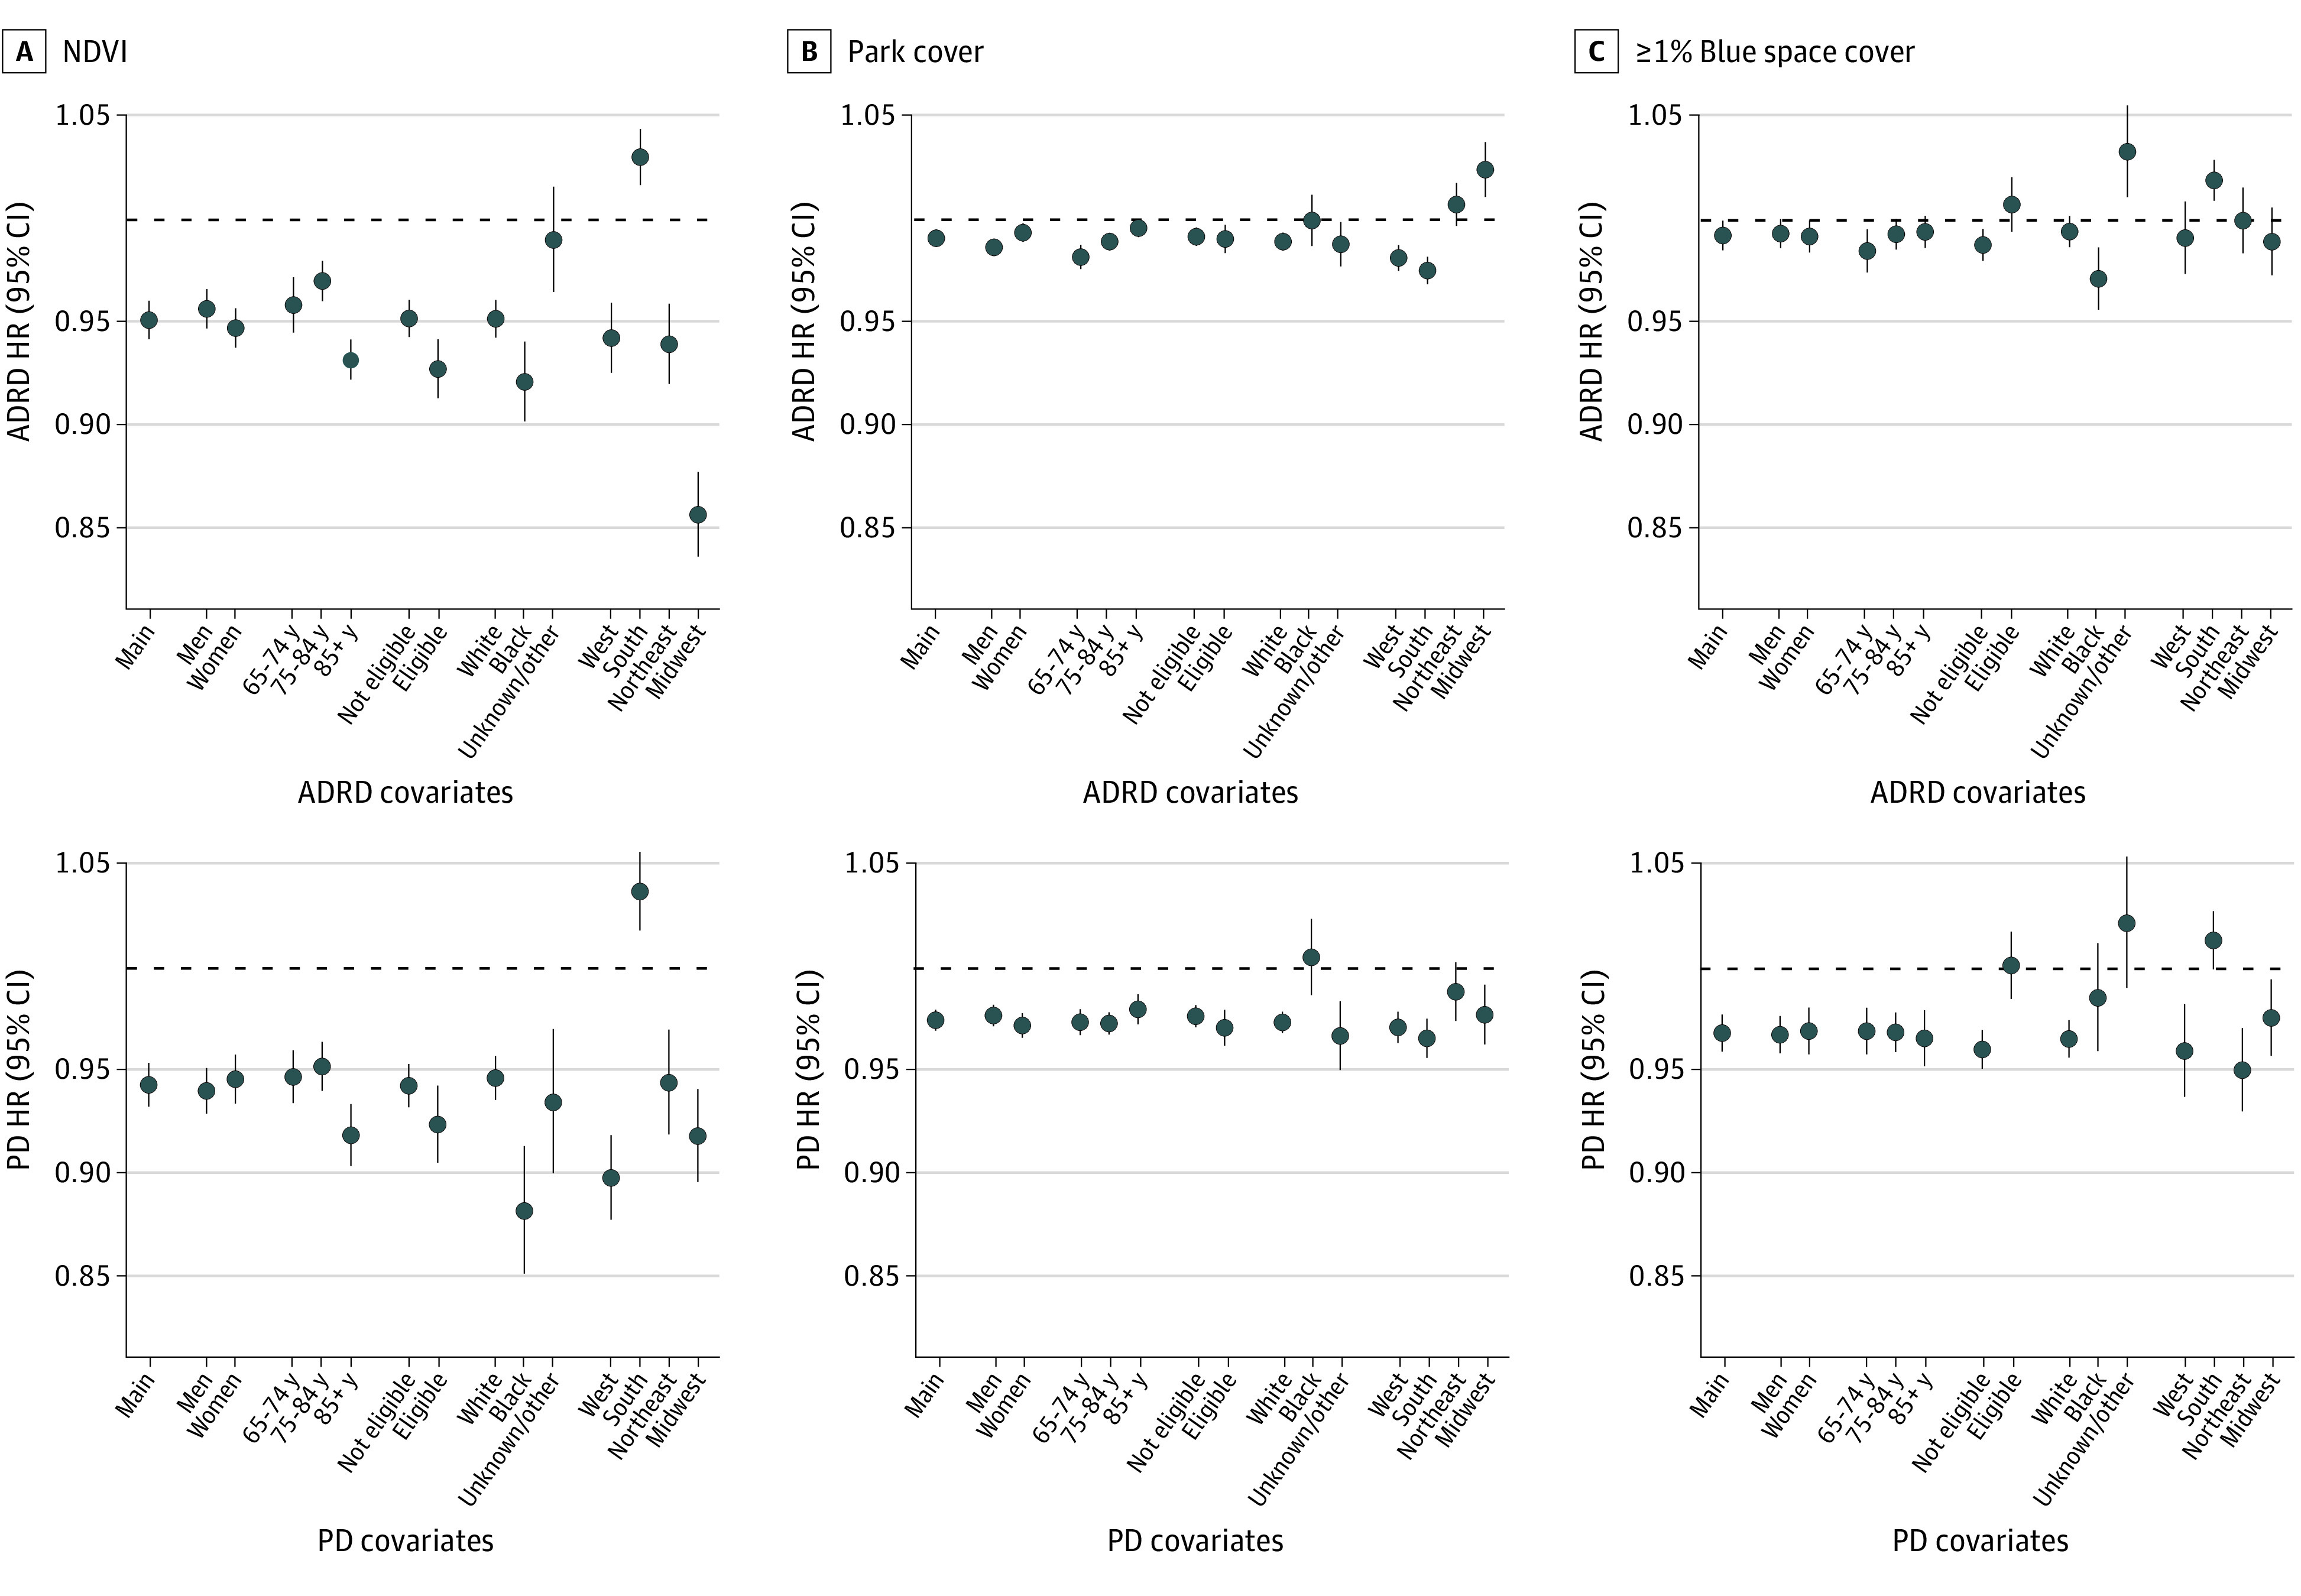
Figure 1. Associations of Normalized Difference Vegetation Index (NDVI), Percentage Park Cover, and Blue Space Cover (≥1.0%) With Hospitalization for Alzheimer Disease and Related Dementias (ADRD) and Parkinson Disease (PD) in the Full Medicare Cohort in Stratified Analyses.

A, Associations of normalized difference vegetation index (NDVI) are expressed per IQR increase of the full cohort (0.27). B, Associations of percentage park cover are expressed per IQR increase of the full cohort (15.9). C, Associations of blue space cover (≥1.0%) are given compared to the reference category (<1.0% blue space cover). Models included NDVI, percentage park cover, and percentage blue space cover and were adjusted for calendar year, region, US Census covariates, percentage ever smoked, an offset for total person-time, and strata for all possible combinations of sex, race and ethnicity, Medicaid eligibility, age at study entry (2-year categories), and follow-up year. HR indicates hazard ratio.
