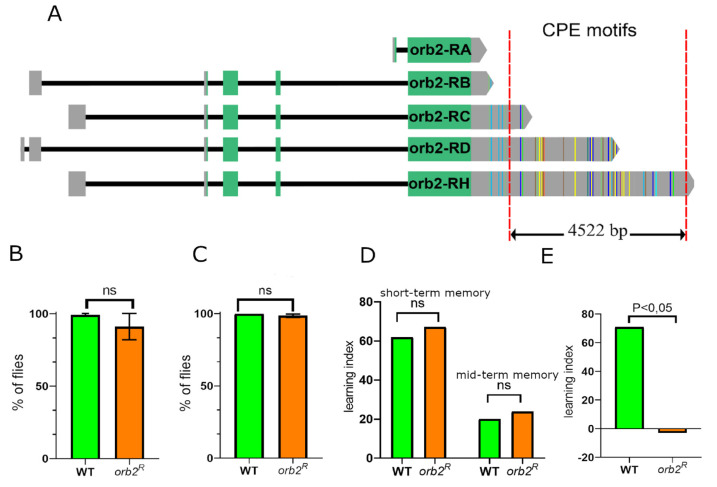
Figure 1.
Influence of the orb2 3’UTR deletion on fly locomotion and memory formation. (A) Schematic representation of orb2 mRNAs. The vertical-colored lines in the 3′UTR (gray region) show the CPE sequences. Different colors of lines correspond to different CPE sequences (see [26] for details). The red dashed lines show the deleted part of the 3′UTR. (B,C) The percentage of WT and orb2R flies that could climb after strong shaking (climbing assay, B) and restore the normal body position after intense shaking (vortex assay, C). The standard deviation is shown, t-test, n = 100; ns – nonsignificant (D,E) Learning indices of WT and orb2R flies as calculated for short-, mid- (D), and long-term (E) memory by assessing the suppression of male sexual behavior after interaction with a previously fertilized female. Assessment of differences between learning indices based on calculated courtship indices (two-side randomization test, p < 0.05, n = 20).

