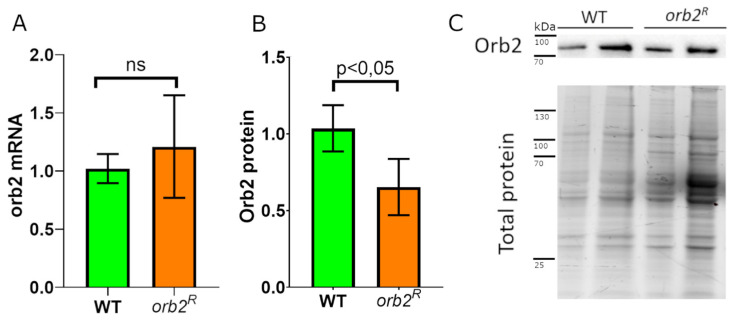
Figure 2.
Effect of the 3′UTR deletion on orb2 gene expression in the brain. (A) Relative levels of the orb2 mRNA in the heads of WT and orb2R flies as determined by qPCR. ns - nonsignificant. (B) Relative amount of the Orb2 protein in the heads of WT and orb2R flies as detected by semiquantitative Western blot. Error bars show the standard deviation (t-test, n = 5). (C) Western blot analysis of head lysates of WT and orb2R flies with antibodies against the Orb2 protein (top). Total protein staining (below) was used for normalization in two-fold serial dilution.

