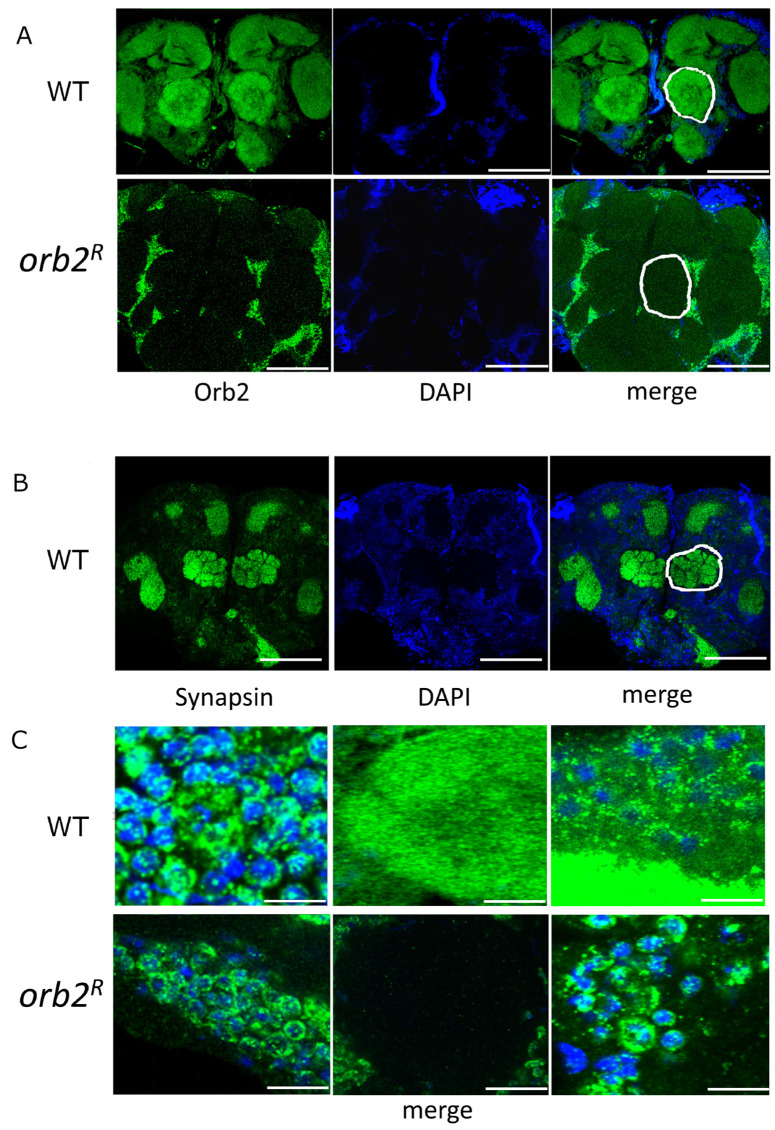
Figure 4.
Distribution of the Orb2 protein in the brain of Drosophila in WT and orb2R mutants. (A) Staining of the entire brain of Drosophila with antibodies against the Orb2 protein (green) and DAPI (blue). The images were obtained with equal exposure. A white line shows the neuropile region. Scale bar, 100 µm. (B) Staining of the WT fly brain with anti-Synapsin antibody to visualize the major neuropile regions (one of them is marked with a white line). Scale bar, 100 µm. (C) Enlarged images of the neuron soma region (left) and neuropile region (middle) in samples of WT and Orb2R flies. Merged images are shown. On the right are long-exposure images to visualize soma and neuropil regions in the same image. Whole brain images for these panels are given in the Supplement (Figures S1–S6). Scale bars for top images are 5, 20, and 5 µm (from left to right). Scale bars for bottom images are 10, 10, and 5 µm (from left to right).

