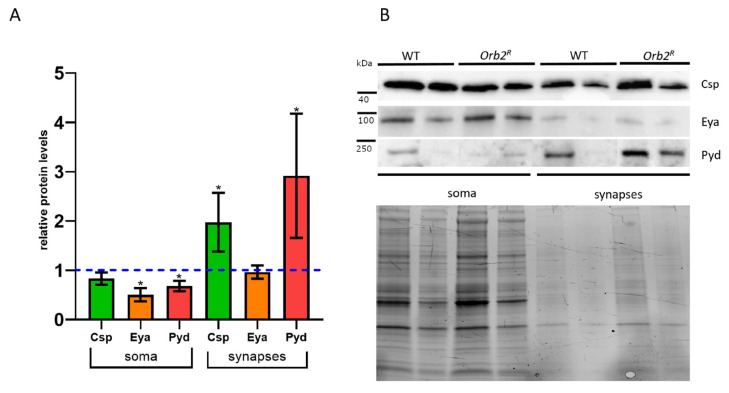
Figure 6.
Intracellular distribution of proteins encoded by potential Orb2 mRNA targets. (A) The relative protein levels in the soma of neurons and synapses. A blue dashed line displays the protein levels in WT flies; bars show the levels in Orb2R flies. Samples were obtained from neuron bodies (LP) and the synaptic (P2) fraction. An asterisk shows the significant change (Student t-test, n = 5, p < 0.05) in protein level in Orb2R flies compared with WT flies. The error bar is the standard deviation. Total protein staining was used for normalization. (B) Western blot analysis of the fractions with antibodies against the Csp, Eya, and Pyd proteins. Two replicas of WT and Orb2R samples are shown.

