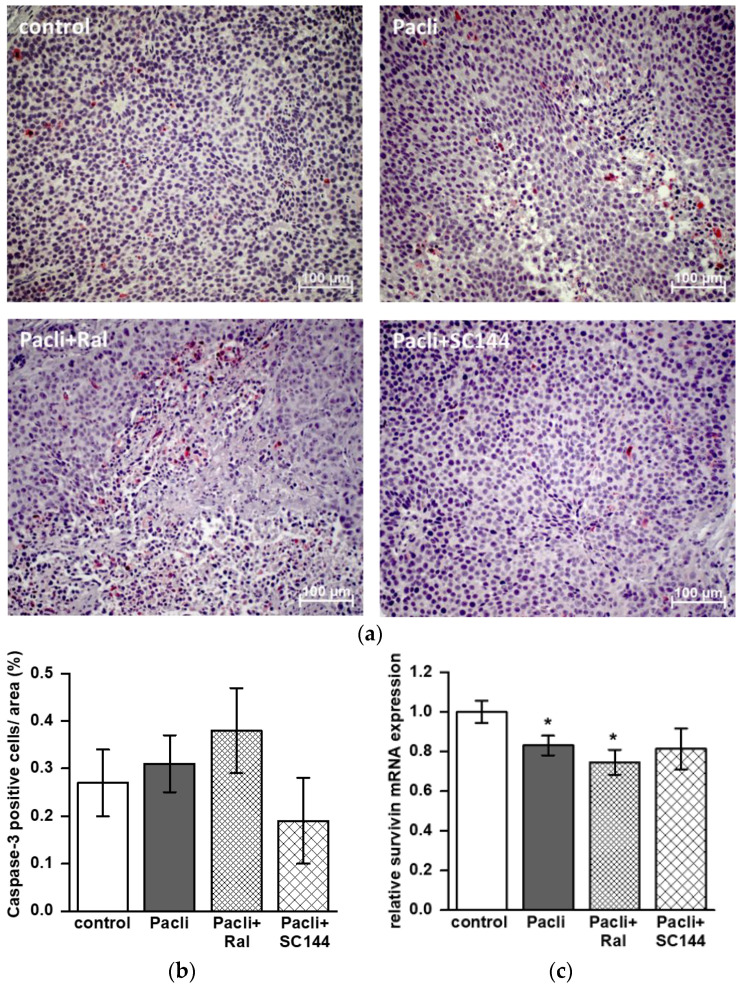
Figure 5.
Staining of caspase-3 positive cells of primary mouse tumors and survivin mRNA expression. (a) Representative staining of caspase-3 in tumor specimens dissected from control, paclitaxel (Pacli), raloxifene/paclitaxel (Ral + Pacli) and SC144/paclitaxel (SC144 + Pacli) treatment groups. (b) Quantification was performed in tumors of n = 5–8 mice of each treatment group. Caspase-3 positive cells were counted in at least five consecutive areas of each specimen (20× magnification), and values are given in percent of positive cells per area ± SEM. (c) Relative mRNA expression level of survivin in tumor samples (* p < 0.05; Figure 5c).

