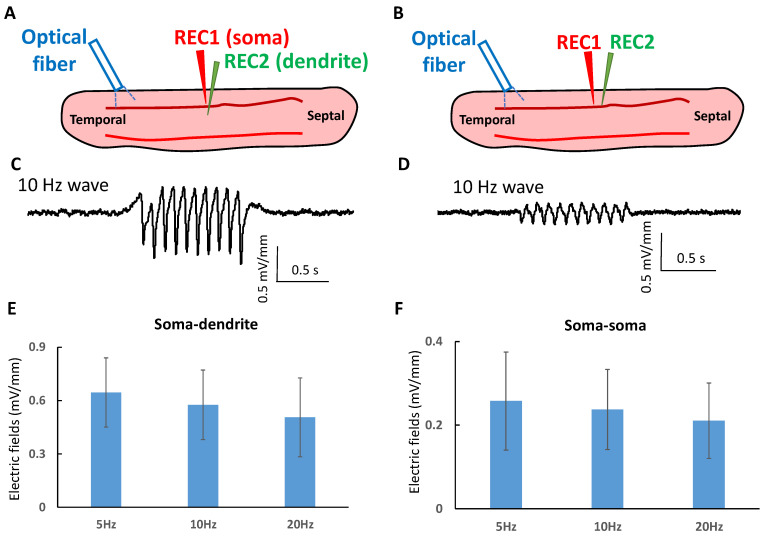
Figure 4.
The endogenous electric fields of the subthreshold waves. (A) The electric field measurement between somatic and dendritic layers. Two electrodes were placed in the somatic and dendritic layers distal to the initiation of the wave to measure the voltage difference. (B) The field measurement along the longitudinal direction. Two electrodes were placed in the cellular layer to measure the voltage and calculate the electric field. (C) An example of the measured electric field between somatic and dendritic layers when the 10 Hz wave was present. (D) An example of the electric field in the longitudinal direction at 10 Hz wave. (E) The electric fields between somatic and dendritic layers were measured at 5 Hz, 10 Hz, and 20 Hz waves (n = 5 slices). (F) The electric fields along the longitudinal direction were measured at 5 Hz, 10 Hz, and 20 Hz waves (n = 5 slices).

