
FIGURE 3.
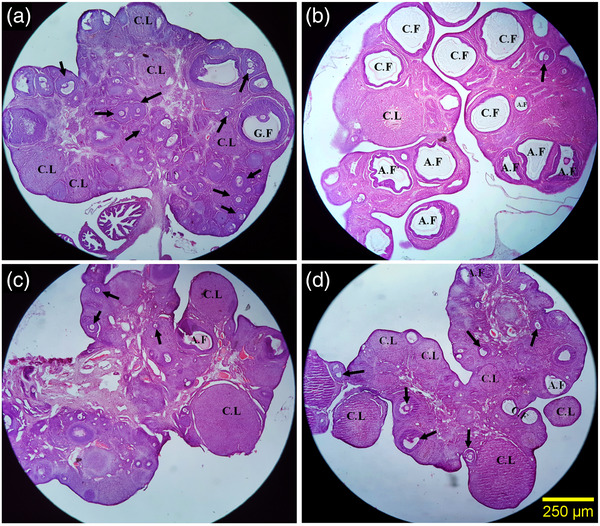
Comparison of the microscopic images of the ovaries in different steps of intermediation. Control group (a): The different developmental stages of folliculogenesis were normal in the healthy control groups, PCOS group (b): The PCOS group showed a significant increase in the number of ovarian cyst and atretic follicles, PCOS+ 5 mg/kg thymoquinone group (c) and PCOS+ 10 mg/kg thymoquinone group (d): In these groups, a significant reduction in the number of ovarian cysts and atretic follicle were observed along with the higher volume of the corpus luteum and healthy follicles. a–d: H&E staining with magnification at × 40. The arrow indicates normal follicles (antral and preantral follicles). Abbreviations: A.F, atretic follicles; C.F, cystic follicles; C.L, corpus luteum; G.F, graafian follicles.