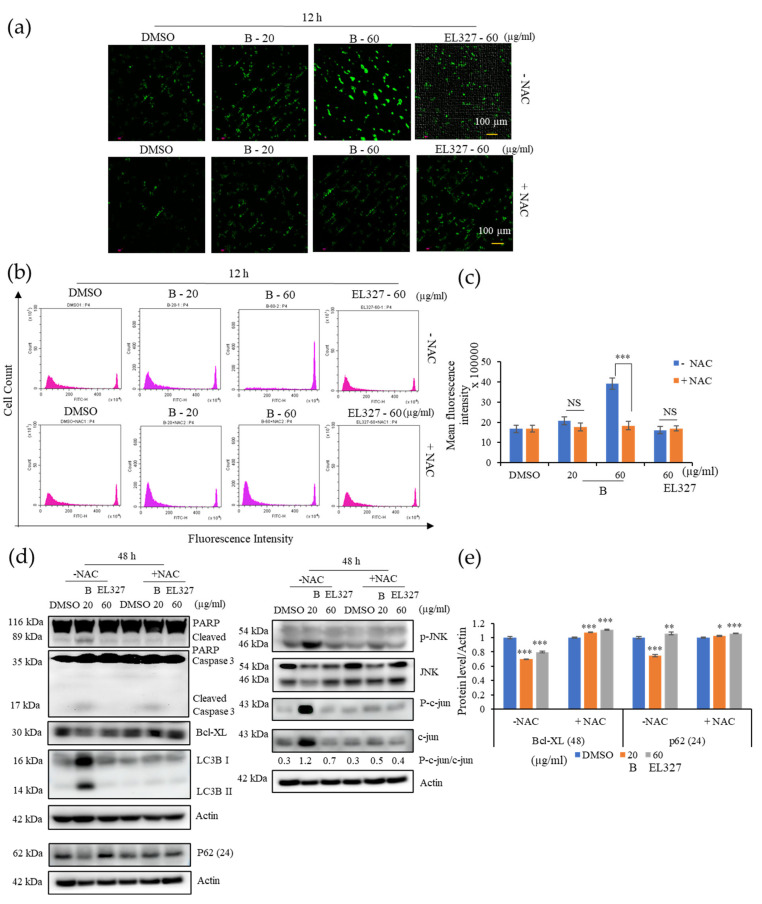
Figure 5.
B induces ROS generation and activates JNK signaling in Caco2 cells. (a) Intracellular ROS generation was detected by fluorescence microscopy using DCFH-DA (10 µM) in Caco2 cells treated with B (20, 60 µg/mL) or EL000327 (60 µg/mL) for 12 h with or without the ROS inhibitor NAC (5 mM). (b) Flow cytometric analysis of the fluorescence intensity of Caco2 cells preincubated with DCFH-DA (10 µM) and treated with B (20, 60 µg/mL) or EL000327 (60 µg/mL) for 12 h with or without NAC (5 mM). (c) Quantification of the mean fluorescence intensity of Caco2 cells preincubated with DCFH-DA (10 µM) and treated with the indicated concentrations of B for 12 h in the presence or absence of NAC. (d) Western blot analysis of PARP, caspase-3, Bcl-xL, p62, LC3BI/II, p-JNK, JNK, p-c-jun, and c-jun protein expression after treatment with B (20, µg/mL) or EL000327 (60 µg/mL) for 24 or 48 h, with or without NAC (5 mM). (e) Quantification of Bcl-XL and p62 protein expressions in the presence or absence of NAC. Data represent the mean ± S.D. * p < 0.05, ** p < 0.01, *** p < 0.001; NS: no significant difference (p > 0.05) compared with the NAC-treated group or the DMSO-treated control.

