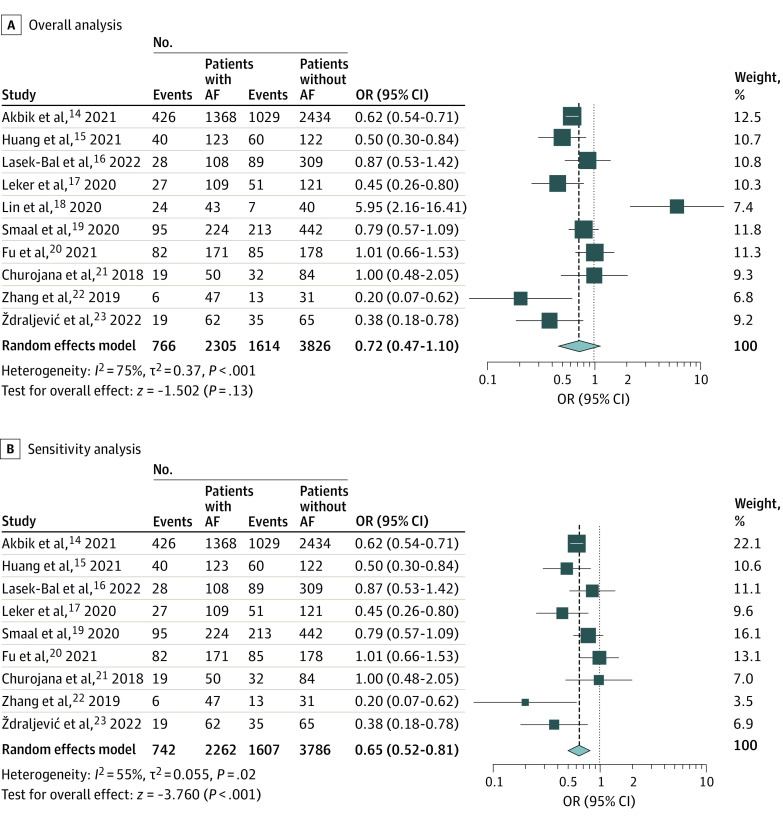
Figure 1. Forest Plot of Odds of Modified Rankin Scale (mRS) Score of 0 to 2 at 90 Days.
Squares indicate odds ratio (OR), with size of squares indicating weight; horizontal lines, 95% CIs for the ORs; diamond, pooled estimate, with points of the diamond indicating the 95% CI for the pooled estimate. AF indicates atrial fibrillation.

