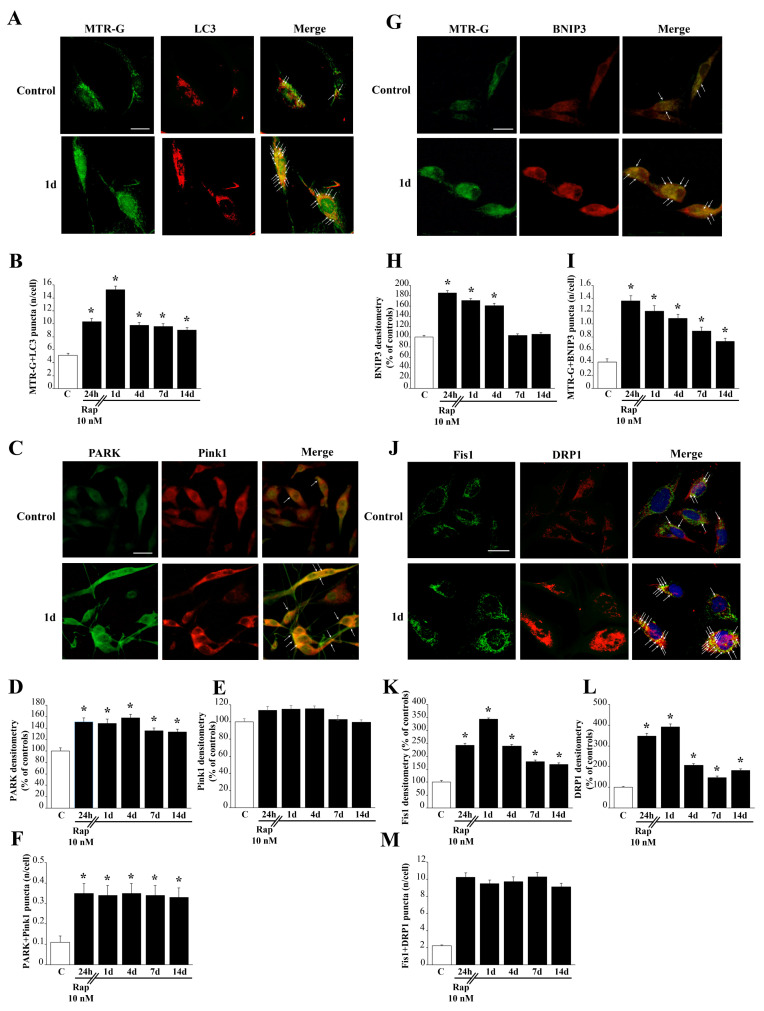
Figure 7.
Rapamycin increases autophagy-related mitochondrial dynamics. (A) Representative pictures show that rapamycin increases histofluorescence of MTR-G and immuno-fluorescence for LC3. Arrows point to merging (yellow) puncta. (B) Graph reports the rapamycin-induced long-lasting increase in MTR-G+LC3 merging puncta. (C) Representative pictures show mitophagy markers PARK and Pink1 from control and rapamycin-treated cells (10 nM at 1 day). Arrows point to merging (yellow) puncta. (D) The graph of PARK immunofluorescence indicates a long-lasting significant increase following rapamycin. (E) The graph shows no significant effect of rapamycin on Pink1 immunofluorescence at any time interval. (F) The graph indicates a significant increase in the number of puncta showing the merging of PARK and Pink1, which exceeds at large the increase induced in PARK immunofluorescence. (G) Representative pictures show that rapamycin increases histofluorescence of MTR-G and immunofluorescence for BNIP3 compared with control. Arrows point to merging (yellow) puncta. (H) Graph reports the rapamycin-induced long-lasting increase in BNIP3 immunofluorescence. (I) Graph reports the rapamycin-induced long-lasting increase in MTR-G+BNIP3 merging puncta. (J) Representative pictures of the fission markers Fis1 and DRP1. Arrows point to merging (yellow) puncta. Graphs (K) and (L) report Fis1 and DRP1 immunofluorescent intensity, respectively. Graph (M) reports Fis1 + DRP1 merging puncta. Values are given as the mean±S.E.M from N = 100 cells per group. C=Controls * p < 0.05 compared with controls. Scale bars: (A) = 13 μm; (C) = 20 μm; (G) = 18 μm; (J) = 13 μm.

