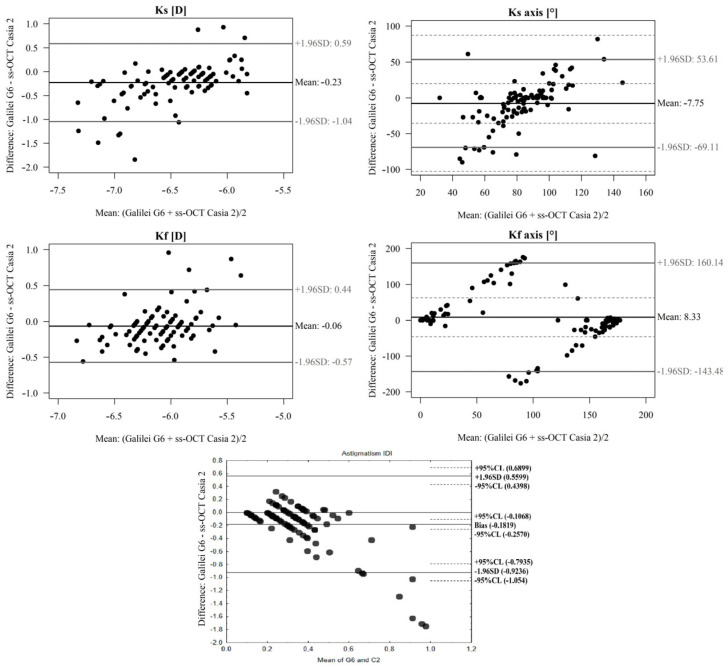
Figure 3.
A Bland–Altman plot showing the agreement of posterior Ks (D), Kf (D), Kf axis (°), Ks axis (°), and posterior astigmatism As. (D) measurements between the OCT Casia 2 and GalileiG6 Dual Scheimpflug Analyzer. The line shows the mean difference, and the top and bottom dashed lines show the upper and lower 95% LoA, respectively.

