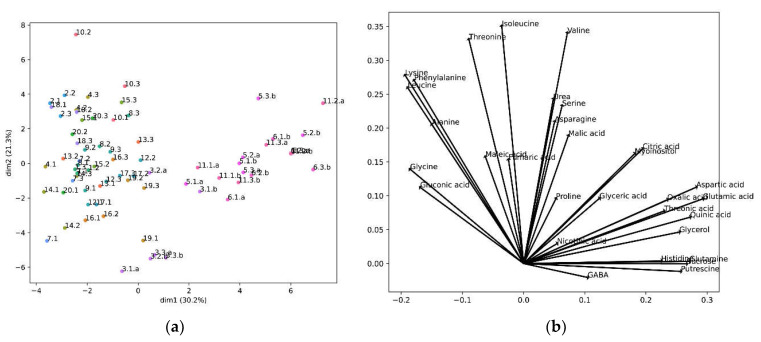
Figure 5.
PCA results: (a) PCA projections of the cultivars in the first two principal components. The percentage shown in the axis labels are the percentage of the variance by each principal component; The first number represents a different cultivar, the second number a biological replicate, and the letter “a” or “b” different technical replicates. (b) Composition of the first two principal components.

