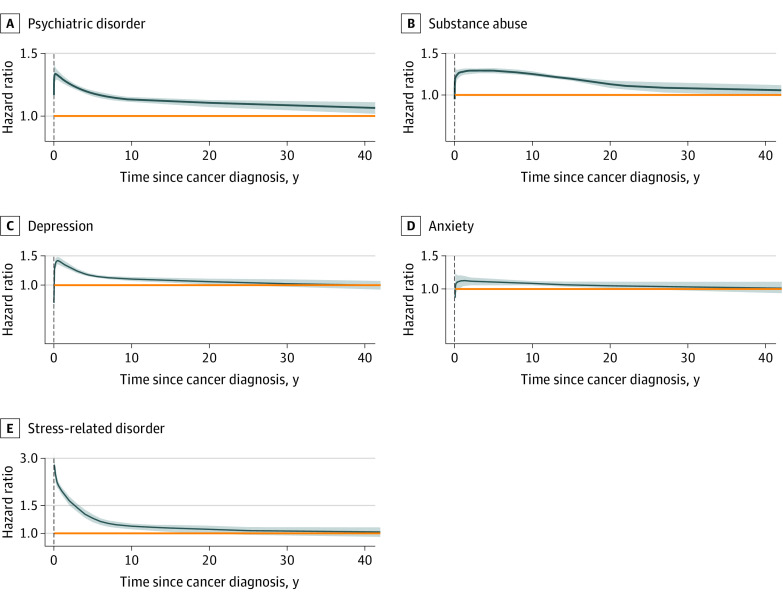
Figure 1. Time-Dependent Hazard Ratios of Any First-Onset Psychiatric Disorder, Substance Abuse, Depression, Anxiety, and Stress-Related Disorder Among Spouses of Patients With Cancer.
The dark blue lines and shaded areas represent the hazard ratios and 95% CIs. The orange horizontal lines indicate a constant hazard ratio at 1 in each panel. Hazard ratios and associated 95% CIs were estimated from flexible parametric models (Royston-Parmar models), allowing the association of a cancer diagnosis of a spouse with the risk of any psychiatric disorder to vary over time. A spline with 5 degrees of freedom (4 intermediate knots and 2 knots at each boundary, placed at quintiles of distribution of events) was used for the baseline rate, whereas a spline with 3 degrees of freedom was used for the time-varying association. The model was adjusted for sex, age at cohort entry, calendar year at cohort entry, country of residence, household income, and history of cancer.

