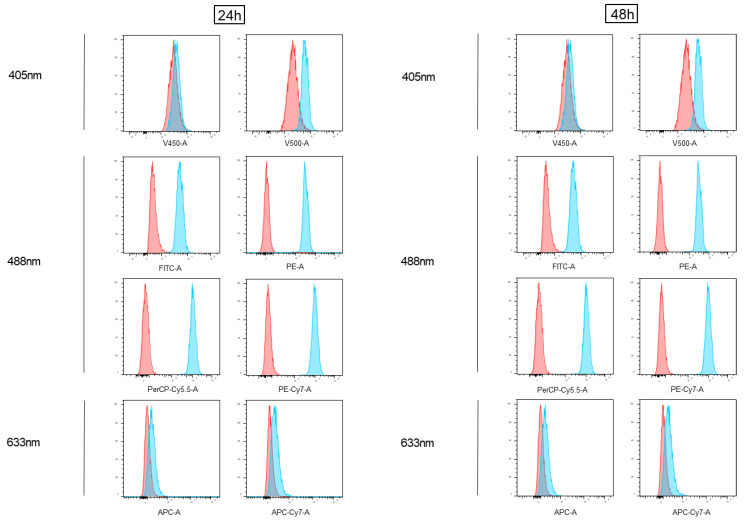
Figure 1.
Analysis of doxorubicin fluorescence emission via conventional flow cytometry (BD FACSVerse). Cells treated with 2.5 µM doxorubicin (Doxo) for 24 and 48 h were acquired using flow cytometry and shown as blue histograms on every channel of a conventional instrument (FACSVerse, BD Biosciences), equipped with three lasers (488 nm, 633 nm, and 405 nm). Overlayed red histograms show the profiles of matched untreated samples. Histograms are representative of three independent experiments.

