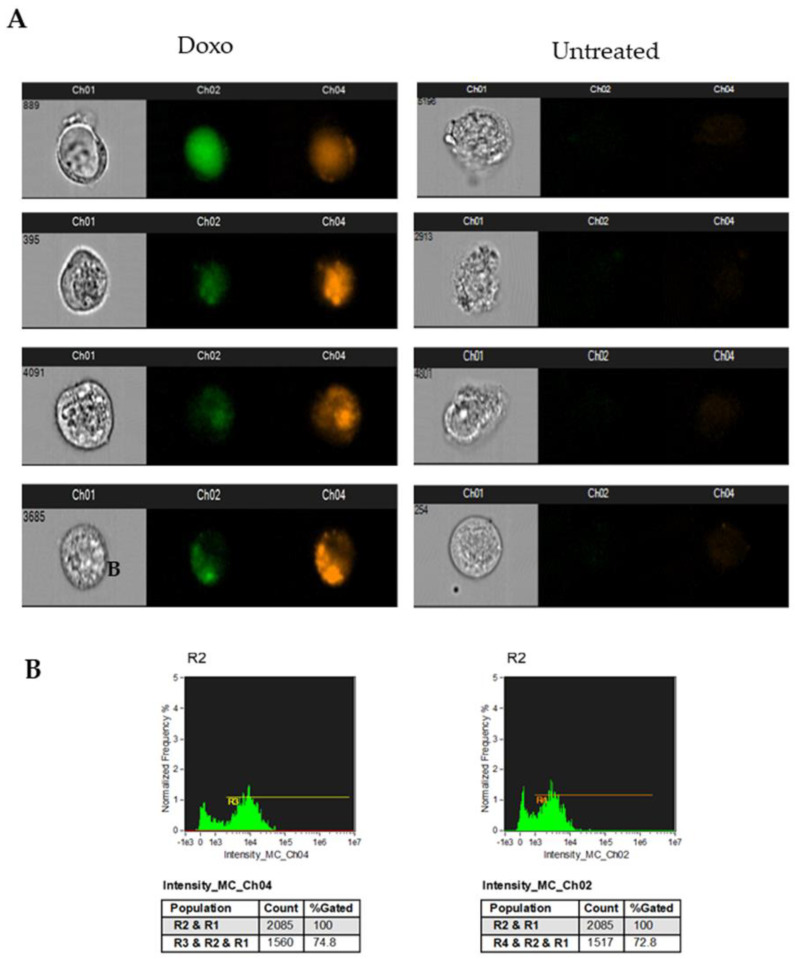
Figure 3.
Analysis of doxorubicin fluorescence emission with ImageStream. MDA-MB-231 cells treated for 24 h with 1 µM doxorubicin were acquired using ImageStream: (A) representative images of treated cell brightfield and fluorescence detected in channel 1 (FITC and analogue fluorochromes) and channel 4 (propidium iodide and analogue fluorochromes) for representative cells treated with doxorubicin (Doxo) or untreated are shown; (B) histograms represent doxorubicin autofluorescence detected in channel 1 (FITC and analogue fluorochromes) and channel 4 (propidium iodide and analogue fluorochromes). Data are representative of three independent experiments.

