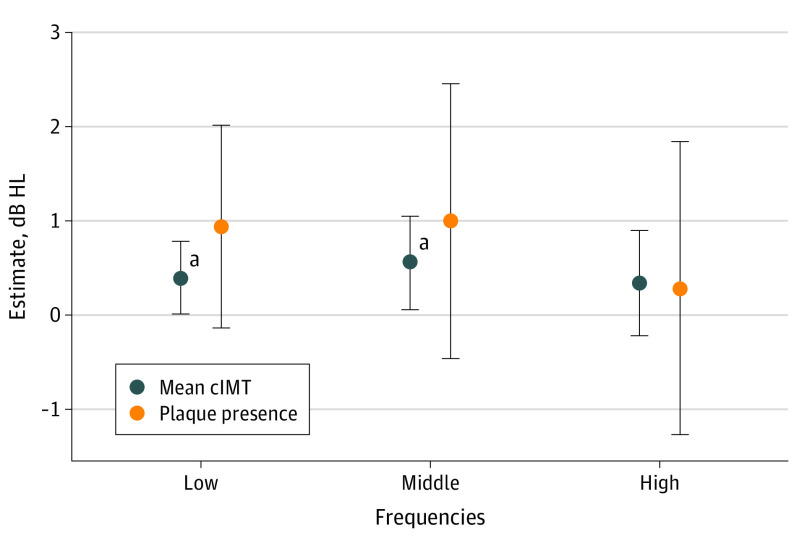
Figure. Linear Regression Estimates for the Association Between Atherosclerosis at Visit 4 (1997-1999) and Hearing PTA in the Better Ear at Visit 6 (2016-2017) Among ARIC Study Participants.
Coefficients correspond to the imputed fully adjusted model. Hearing levels defined as low-frequency (0.25 and 0.5 kHz; n = 3590), mid-frequency (1.0 and 2.0 kHz; n = 3594), and high-frequency (4.0 and 8.0 kHz; n = 3243) PTA. ARIC refers to the Atherosclerosis Risk in Communities study; cIMT, carotid intima media thickness; db HL, decibel hearing level; kHz, kilohertz; and PTA, pure tone average.
aNull hypothesis not within the 95% CI.

