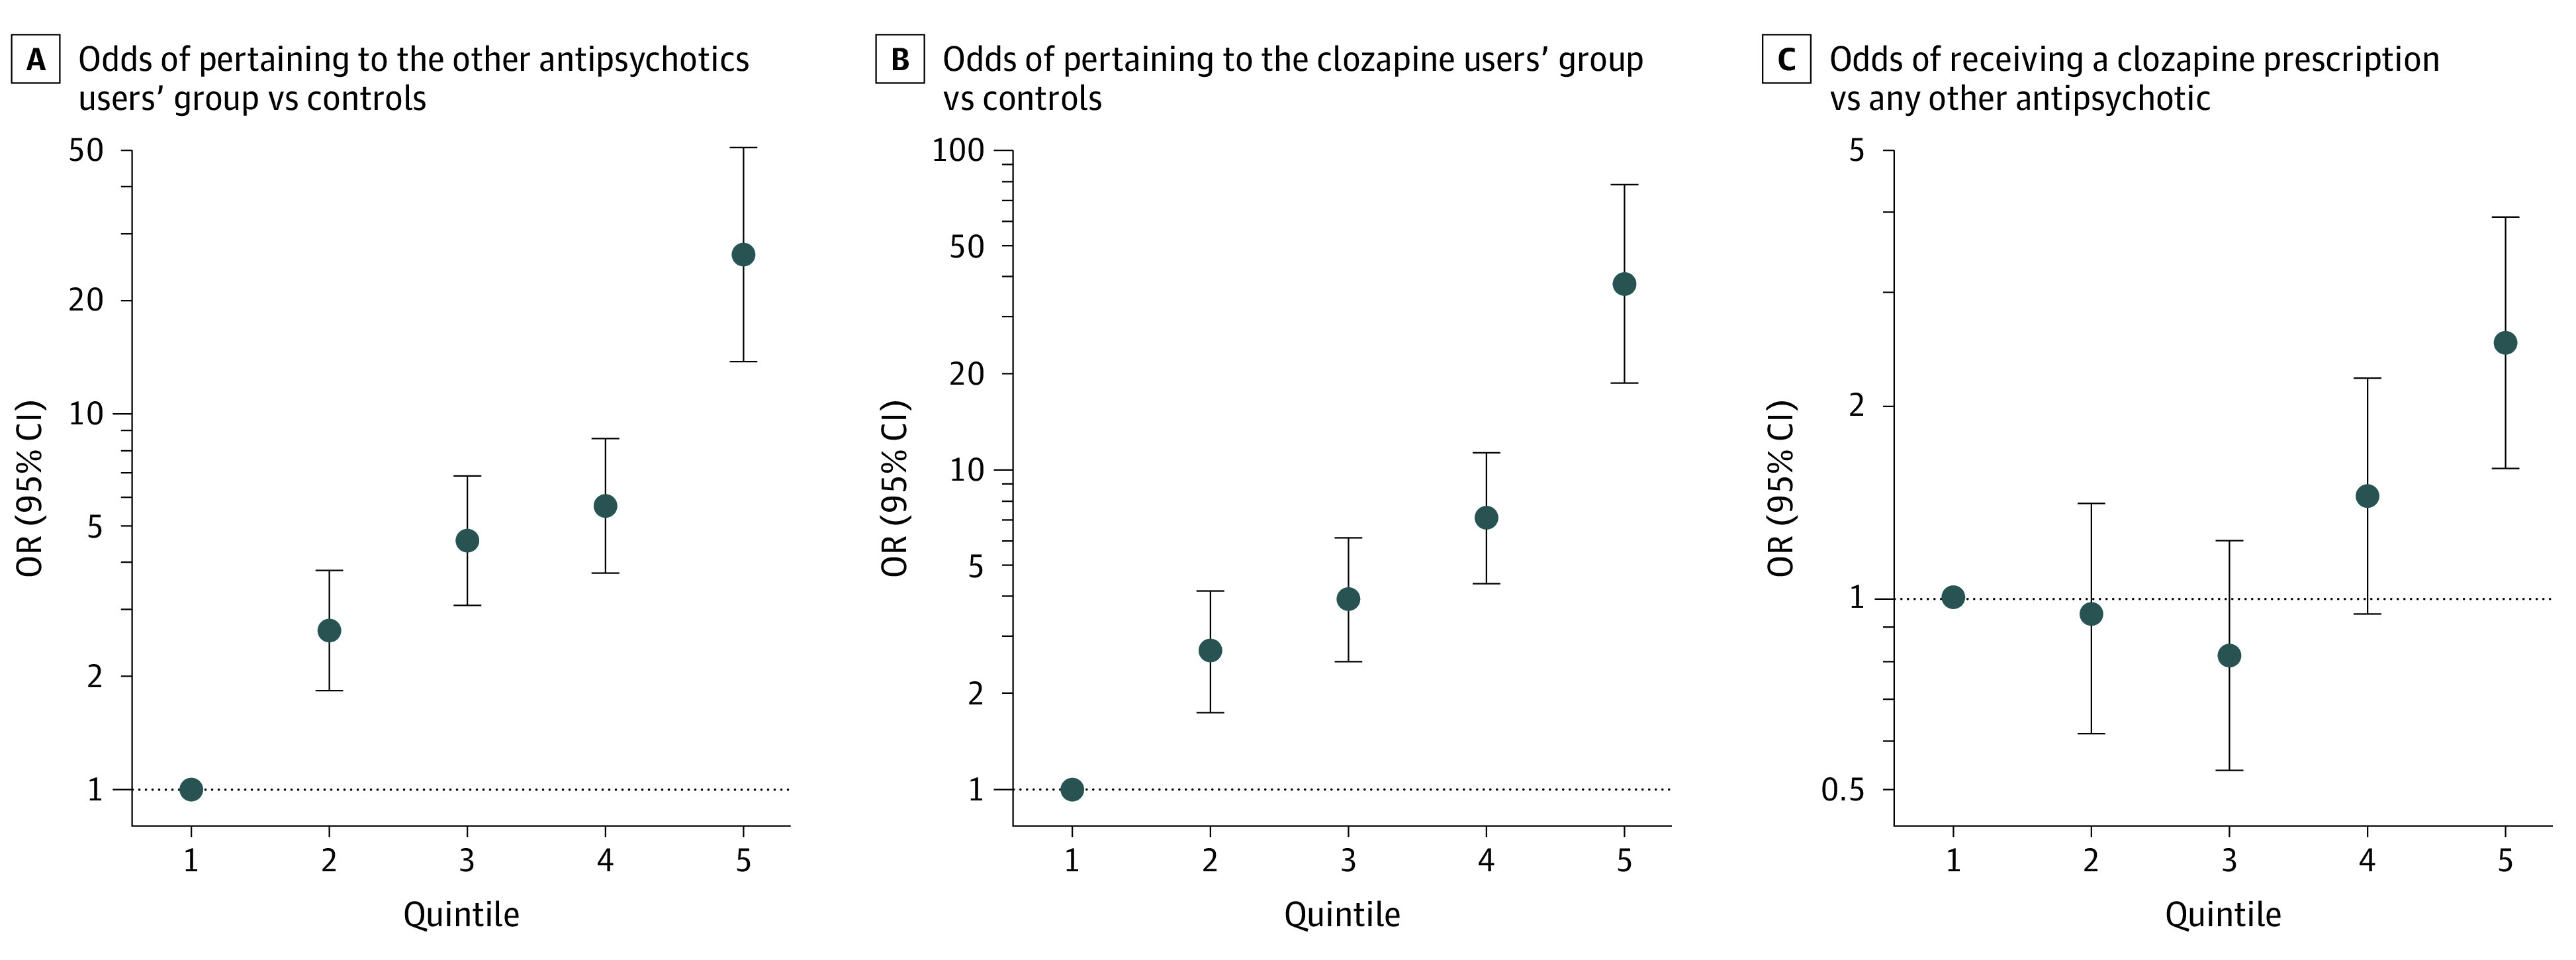
Figure 2. Odds Ratios by Polygenic Risk Profile.

Odds ratios (ORs) increased with greater number of schizophrenia risk alleles in each group, with maximums reached in the fifth quintiles for individuals with schizophrenia spectrum disorders who were taking other antipsychotics relative to controls (panel A: OR, 26.41; 95% CI, 13.72-50.84), for clozapine users relative to controls (panel B: OR, 38.21; 95% CI, 18.96-78.11), and for clozapine users relative to users of other antipsychotics (panel C: OR, 2.50; 95% CI, 1.80-3.93). Odds ratios are shown in a log scale on the y-axis by genetic risk score profile; note the change in scale on each y-axis. Polygenic risk scores were divided into quintiles (1 = lowest, 5 = highest), and 4 dummy variables were created to contrast quintiles 2 through 5 to quintile 1 as reference. Odds ratios and 95% CIs were estimated using logistic regression.
