
Figure 4. Association of Variation in Cochlear Implant Outcomes With Underlying Genotype.
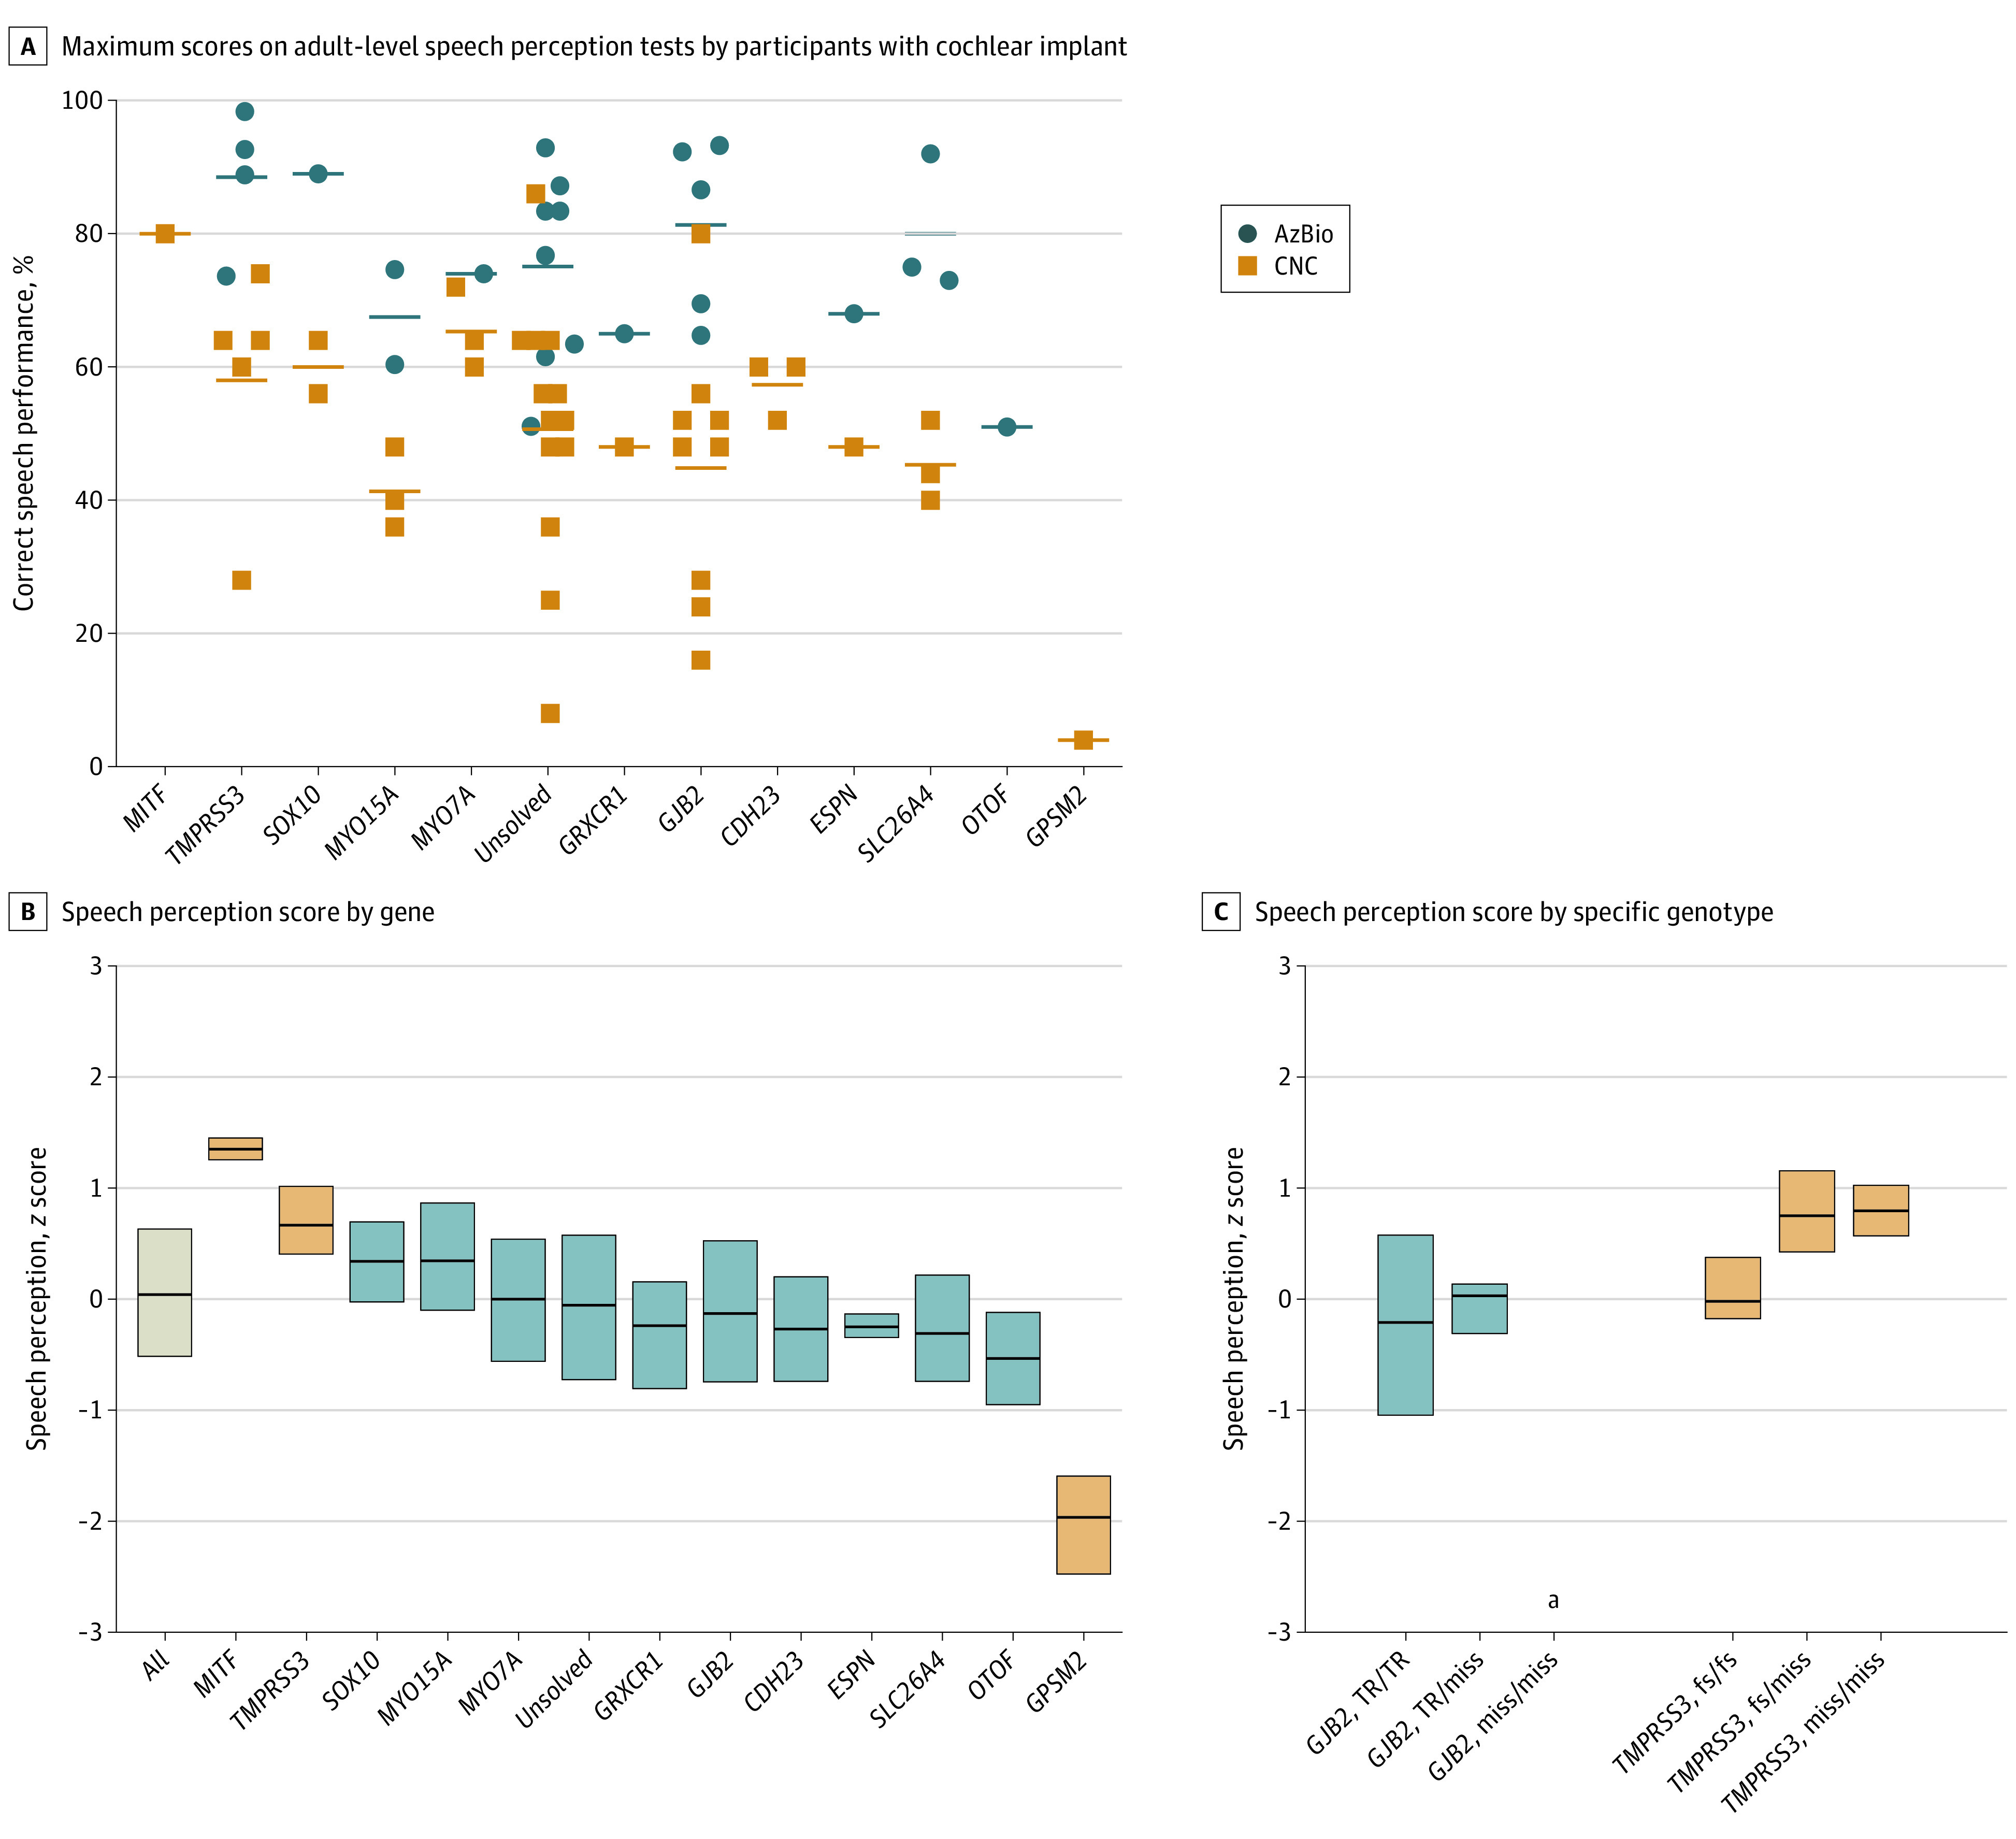
A, Maximum scores for adult-level speech perception tests, CNC (words) and AzBio (Quiet), for each individual with a cochlear implant as separated by causative gene. B, Speech perception scores by gene. Scores for each test (HINT-C, Pediatric AzBio, AzBio, PBK, and CNC) were converted to z scores by comparison with the mean for that test. For each participant, the best score for each test was included. Box plots represent 25%, 50%, and 75% percentiles. After adjusting for age at implant and time between implant and testing, scores for participants with variants in MITF or TMPRSS3 were higher than average and for the participant with variants in GPSM2 were lower than average (blue boxes) (eTable 6B in Supplement 1). The child with GPSM2 hearing loss had a syndromic presentation, including developmental delay. C, There were no significant differences by genotype for participants with variants in GJB2 or TMPRSS3. None of the patients with 2 GJB2 missense variants had cochlear implants.